Fig. 7.
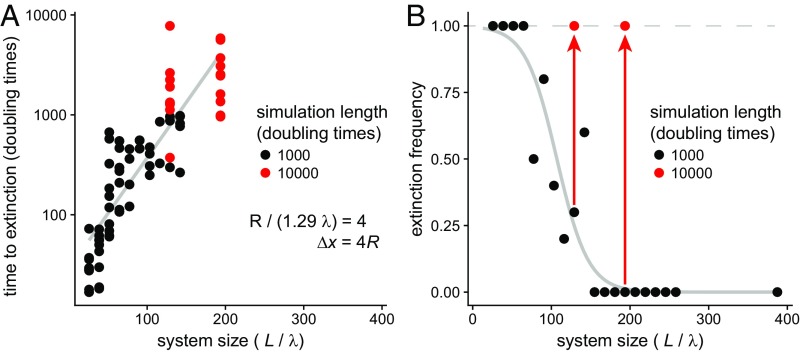
Larger system sizes delay but do not prevent extinction cascades. (A) Plotting time to extinction as a function of system size reveals an approximately exponential relationship, suggesting that larger systems can persist in a state of chaotic fluctuation for longer time periods. Each point is a single simulation, with 10 replicate simulations per system size L. (B) Extinction frequency as a function of system size. The black points and fitted gray logistic regression curve suggest a critical system size at which extinctions are no longer observed for the fixed number of simulated doubling times (here, 1,000). However, by increasing simulation duration, the observed extinction frequency saturates to ∼1 (red points and arrows), indicating that large systems delay but do not prevent extinction, consistent with our model, which predicts that all anisotropic environments will eventually end with an extinction cascade. Simulation parameters are R/(1.29 λ) = 4, Δx = 4 R, P = 0.1, and Amin = 0.01, with system size L as indicated in the figure.

