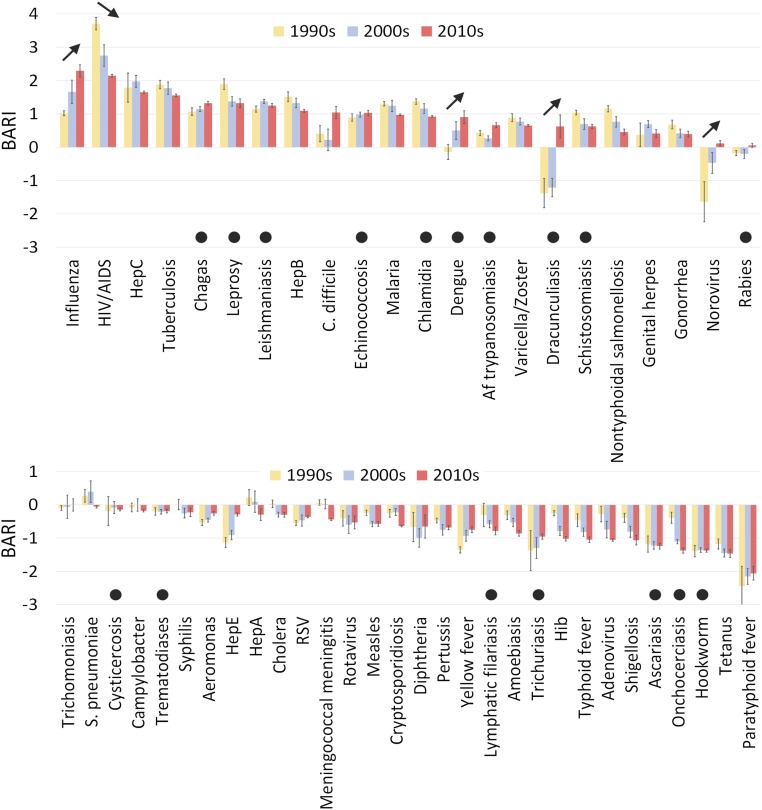
Fig. 2.
Indices of BARI for the 52 infectious diseases in the 1990s, 2000s, and 2010s, calculated for each year and averaged by decade. The diseases are ordered according to the index in the 2010s. Error bars show SD of the indices of each year. Black dots indicate neglected tropical diseases, and slanted arrows indicate diseases with significant change in the BARI over the three decades.

