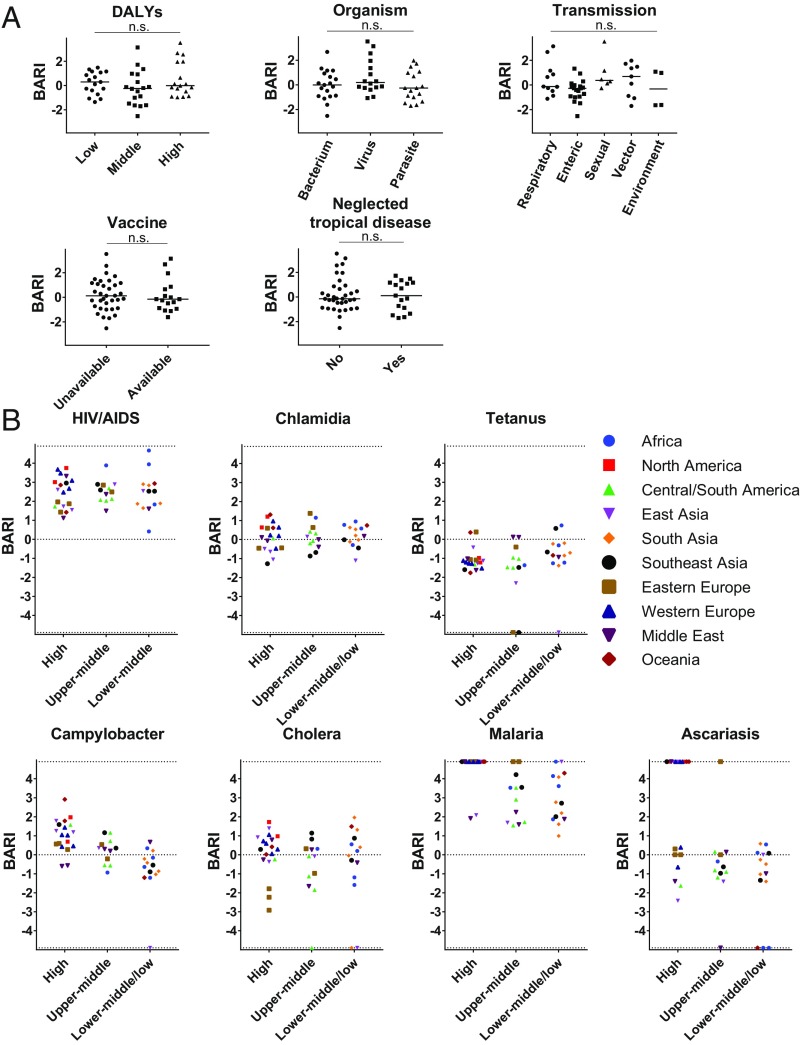
Fig. 3.
Analysis of the BARI index of infectious diseases at global and country levels. (A) BARI index by disease classification at a global level. The median for each group is shown by a horizontal line. The disease burden in DALYs was grouped by tertile. Difference in indices between and among categories was tested by the Kruskal–Wallis Test. n.s., not significant. (B) The index for representative diseases at a country level by region and economic level. When there are one or more publications about a disease that has no DALYs there, dots were plotted on the top horizontal broken line. When there is no publication about a disease that has no DALYs there, dots were plotted on the middle horizontal broken line. When there is no publication about a disease that has DALYs there, dots were plotted on the bottom horizontal broken line. Results for all 52 diseases can be found in SI Appendix, Fig. S2.

