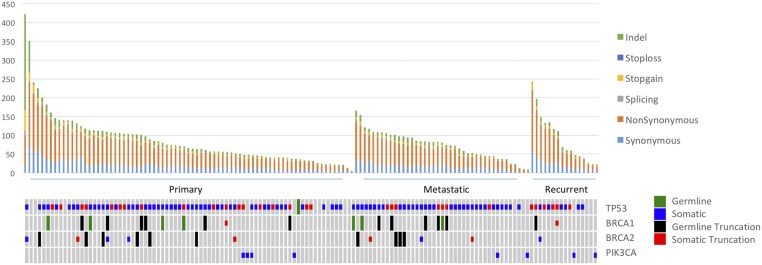
Fig. 1.
Distribution of somatic mutations. Each tumor was analyzed for somatic mutation burden and mutation type. Recurrent tumors also contained the highest non–synonymous-to-synonymous ratio of somatic mutations (3.59:1), followed by metastatic tumors (3.45:1) and primary tumors (3.23:1). For patients with two primary tumors, only the right tumor was included in this distribution.

