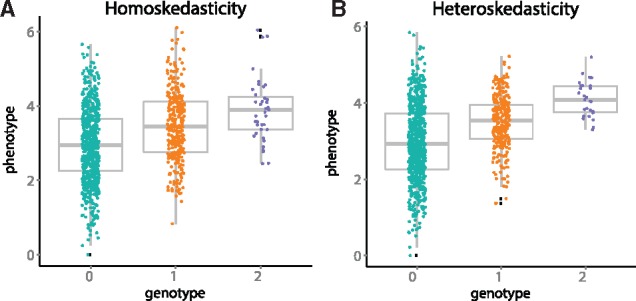
Fig. 1.

Example of heteroskedasticity for biallelic variation. The x-axis is genotypes represented as the number of copies of the minor allele. The y-axis is the quantitative trait values across individuals sampled from a population. Panel A: Homoskedasticity, where each trait distribution from three genotypes have equal variance. Panel B: Heteroskedasticity, where each trait distribution from three genotypes have different variances. The data were simulated with n = 1000 with minor allele frequency πmaf = 0.2; each genotype group was plotted with x-axis jitter to show data density
