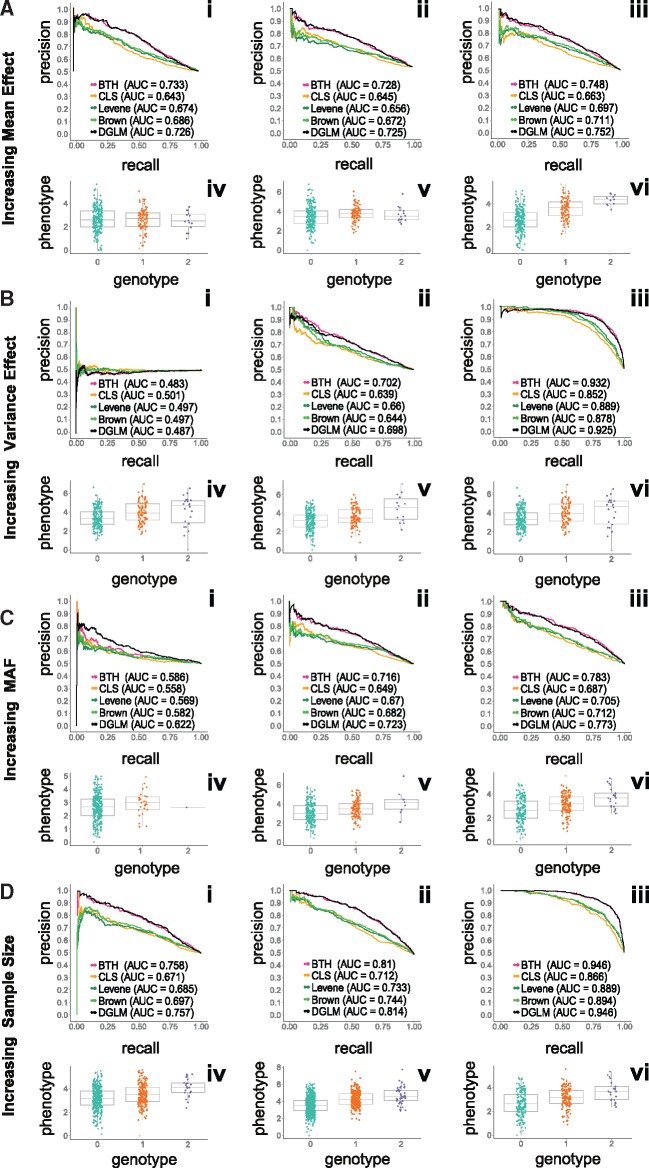
Fig. 2.
Precision-recall curves comparing performance of BTH versus three other methods and example plots of underlying discrete simulated data. Panel A: increasing mean effect size: πmaf = 0.2, n = 300, ; Panel B: increasing the variance effects: , n = 300, ; Panel C: increasing minor allele frequency: , n = 300, ; Panel D: increasing sample size:

