Fig. 11.

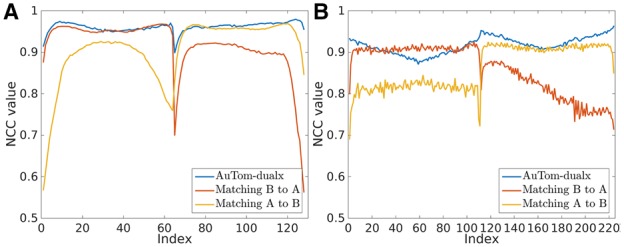
The NCC curves between the reprojection of the reconstruction for both AuTom-dualx and IMOD and the original tilt series for the Centriole dataset (A) and the Adhesion belt dataset (B)

The NCC curves between the reprojection of the reconstruction for both AuTom-dualx and IMOD and the original tilt series for the Centriole dataset (A) and the Adhesion belt dataset (B)