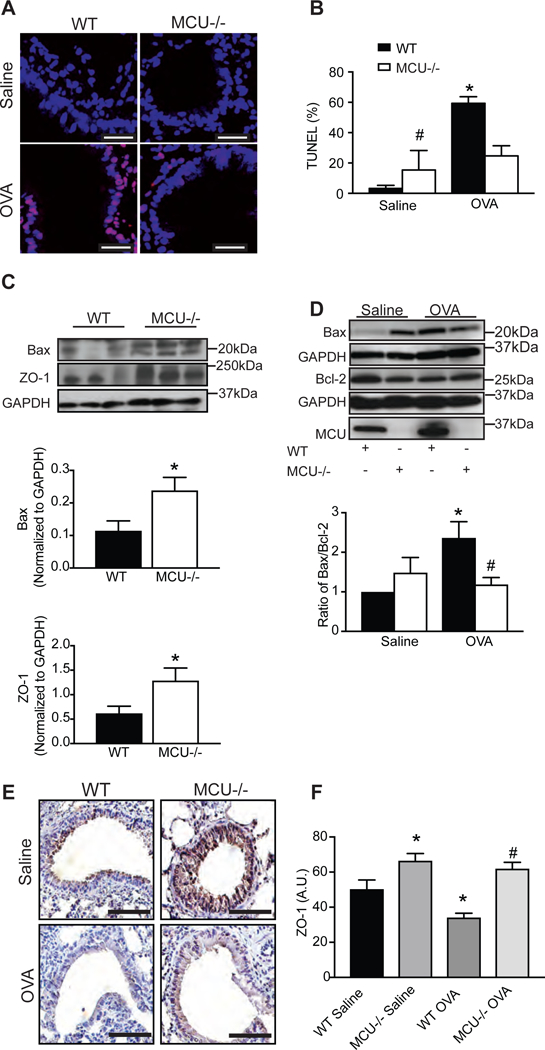
Figure 6. MCU knockout protects from respiratory epithelial cell death and barrier breakdown after OVA exposure in vivo.

(A) Representative staining (TUNEL red; nuclei TO-PRO blue) and (B) quantification of apoptotic cells. Cells were counted in 4–5 visual fields per condition (63x magnification). Scale bar 100μm. (C) Representative immunoblot and quantification of Bax or ZO-1 in lung homogenates (n = 8 WT saline mice and 7 MCU−/− saline mice). (D) Representative immunoblot for Bax, Bcl-2 and MCU. Quantification of Bax/Bcl-2 ratio in WT and MCU KO mice (n = 8 WT saline mice, 6 WT OVA-challenged mice, 7 MCU−/− saline and 7 MCU−/−OVA-challenged mice). Data are represented as fold change over WT saline control. (E, F) Representative immunohistochemistry and scoring for ZO-1 in lung sections of OVA- or saline-challenged WT or MCU−/− mice. Scale bar 50μm. Student’s two-tailed t-test was used for (C); one-way ANOVA with Tukey post hoc test used for all other measurements. * p < 0.05 vs. saline; # p < 0.05 vs. WT mice treated with OVA.
