
Fig. 2. Preferential expansion of Th17 cells in experimental periodontitis.
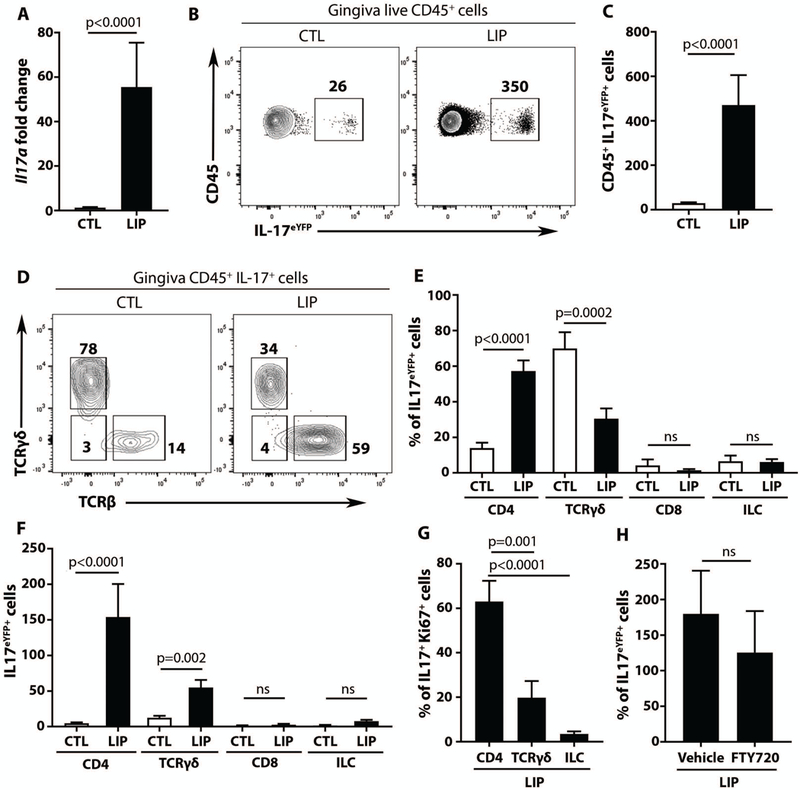
(A) IL-17a mRNA expression in gingival tissues at baseline (CTL) and after ligature induced periodontitis (LIP) (n=10 mice per group, 2 separate experiments, Mann Whitney test, mean±SEM). (B-C) IL-17+CD45+ cells at baseline and LIP, in IL-17acreR26ReYFP mice. FACS plot (B) and graph (C) indicating numbers of CD45eYFP+ cells per standardized tissue (n=12 per group, 3 separate experiments, unpaired t test, mean±SEM). (D-F) Proportions and numbers of IL-17+ cells at baseline and LIP. FACS plots (D) and graph (E) showing percentage of eYFP+ cells. (F) Graph showing numbers of eYFP+, per standardized gingival tissue (n=10, 3 separate experiments). (G) Ki67+ staining in IL-17+ cells in LIP (n=6, 2 separate experiments, one-way ANOVA and Tukey’s multiple comparisons test, mean±SEM for E-G). (H) Numbers of eYFP+ cells per gingival tissue in LIP with/without FTY720 (n=5, 2 separate experiments, Mann-Whitney test, mean±SEM). All p values are indicated in graphs.