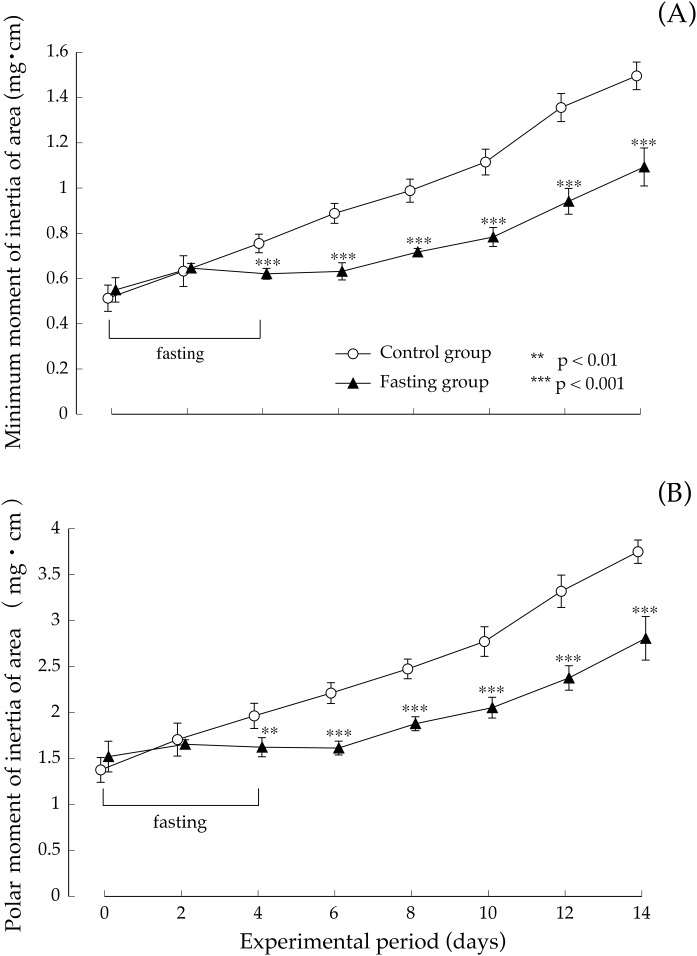
Figure 8. Minimum cross-sectional moment and polar moment of rats in the experimental period.
(A) Changes of the minimum moment of rats during the experiment period. (B) Changes of the polar moment of rats during the experiment period. Values are means ± SD of control group (n = 5) and fasting group (n = 6). Student’s t-test was used to compare two groups. **p < 0.01, ***p < 0.001, significantly different from the control value.

