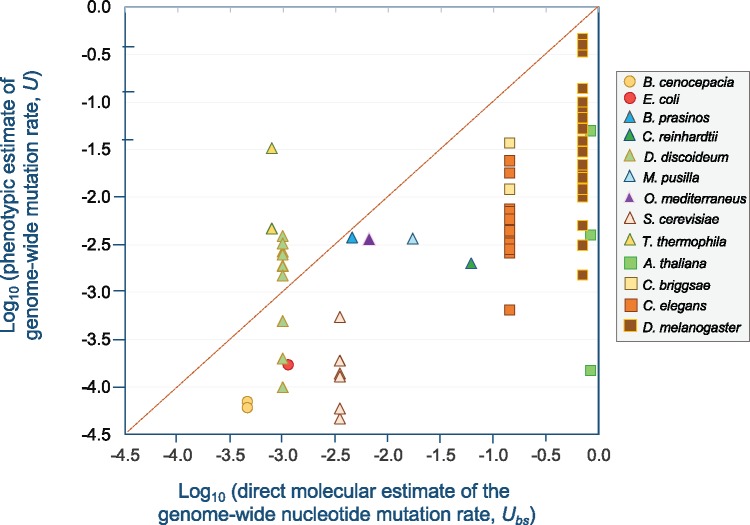
Fig. 2.
—Phenotypic estimates of the genome-wide mutation rate, U, as a function of the direct molecular estimates of the genome-wide nucleotide mutation rate, Ubs, generated from whole-genome sequence data. U is represented as the number of mutations per genome per generation. For direct molecular estimates of the U from MA-WGS studies, the base substitution rate was utilized as it was the most readily available across different MA studies for different species. Multiple data points for a species represent phenotypic estimates of U for different fitness traits assayed. For species with multiple molecular estimates of U from WGS data, the average rate was used. The dashed red line represents a hypothetical one-to-one relationship between phenotypic and molecular estimates of U. With the exception of the two protist species Dictyostelium discoideum and T. thermophila, direct molecular estimates of U can be up to several orders of magnitude higher than their counterparts from Bateman–Mukai or maximum likelihood analyses of phenotypic data. Prokaryotic species are denoted by circles. Unicellular and multicellular eukaryotes are denoted by triangles and squares, respectively. All plotted data are presented in supplementary table S1, Supplementary Material online.

