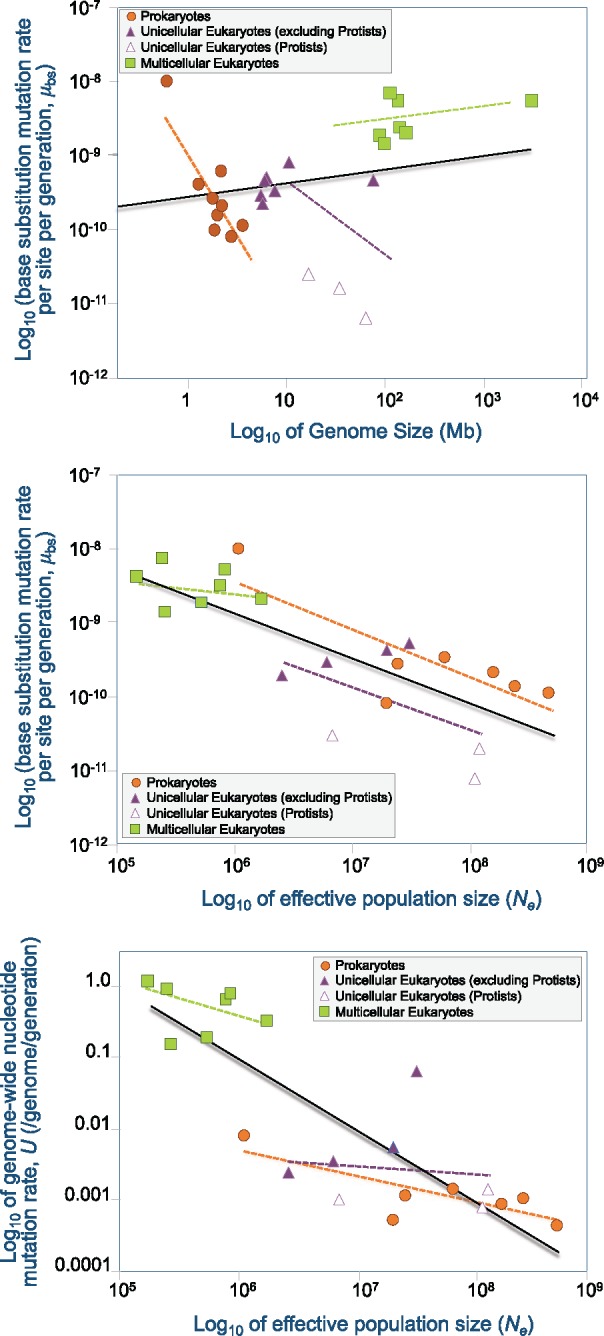
Fig. 3.

—Relationship between spontaneous mutation rates from MA-WGS studies, genome size and effective population size (Ne). Prokaryote, unicellular and multicellular eukaryotes species are represented by orange circles, purple triangles, and green squares, respectively. Three protists (the ciliates Paramecium tetraurelia and T. thermophila, and the social amoeba Dictyostelium discoideum) are represented in open triangles. The solid black lines are representative of the entire data set comprising prokaryote, unicellular eukaryotes, and multicellular eukaryotes. Dashed orange, purple, and green lines are representative of prokaryotes, unicellular eukaryotes, and multicellular eukaryotes, respectively. All plotted data are presented in supplementary table S2, Supplementary Material online. (A) Base substitution mutation rate per nucleotide site per generation, μbs, as a function of genome size. The mutation rate is inversely correlated with genome size in prokaryotes (r = −0.90, P = 0.009, n = 9). (B) Base substitution mutation rate per nucleotide site per generation, μbs, as a function of effective population size, Ne. μbs is inversely correlated with Ne across all taxa (r = −0.78, P = 3E-05, n = 21) and within prokaryotes (r = −0.81, P = 0.028, n = 7). (C) Genome-wide mutation rate per genome per generation, U, as a function of effective population size, Ne. U is inversely correlated with Ne across all taxa (r = −0.83, P < 10−5, n = 21) and within prokaryotes (r = −0.80, P = 0.031, n = 7).
