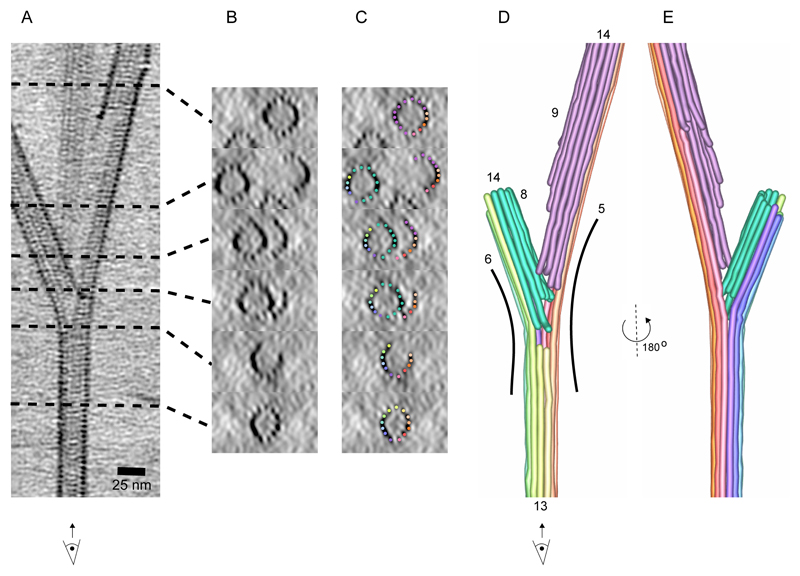
Fig. 3. The cryo-ET reconstruction of SSNA1-mediated microtubule branch.
(A) A 25-nm slice of a tomographic reconstruction highlighting branching point of a microtubule. With this view, individual protofilaments and tubulin units are visible, but the SSNA1 density is too thin to be visualized. (B) Cross-sections of the branched microtubules in A. (C) Individual protofilaments are overlaid with color represented in the segmentation in D. (D) Tracing of protofilaments of the 3D density map in A. Individual protofilaments are colored in rainbow-color coding. The newly formed protofilaments from the branched microtubules are colored in green (left) and in pink (right). Number of protofilaments in this particular branched microtubule are counted to be 13 (mother microtubule), 14 (left branched microtubule) and 14 (right, branched microtubule). 13 mother protofilaments are split to 6 to the left and 5 to the right side of branched microtubules. (E) 180° rotated segmentation of the branched microtubule.

