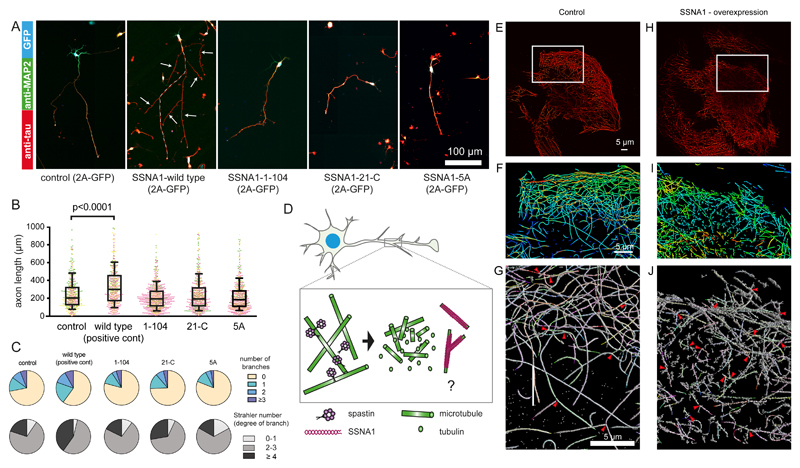
Fig. 6. Effect of various SSNA1 constructs on primary hippocampal neurons and fibroblast cells.
(A) Immunostaining of MAP2 (green), Tau (red) and GFP (blue, expression control) in mSSNA1 over-expressing cells. For the SSNA1 WT, the axon is guided with a dotted line. (B) Scatter dot plots of axon length under over-expression of various SSNA1. Control and WT profiles shown in Fig. 1 are placed as a negative and positive control, respectively. The promotion of axon development occurs only in over-expression of WT SSNA1, while no apparent effect was observed for the constructs that fail to mediate microtubule branching. Every cell is represented by a single point, control (n=496 cells), wild type (n=490), 1-104 (n=788), 21-C (n=610), 5A (n=642) from 3 independent experiments, shown in magenta, green and yellow, and the overlaid box-and-whisker plots cover 50% (boxes) and 90% (whiskers) of the entire population, with median values indicated as lines within the boxes. (C) Pie graphs showing the distribution of the number of branches and Strahler number under different over-expression conditions. GFP expression control and SSNA1 WT overexpression profiles in Fig. 1 are placed as controls. (D) Schematic model describing how SSNA1-mediated microtubule nucleation could contribute to axon branch formation. Spastin has been shown to localize at axon branches7 and to interact with SSNA136. Taken together with our finding of SSNA1 localization at axon branches, it is possible that the two proteins work sequentially by spastin severing microtubules to provide tubulin oligomers, and SSNA1 nucleating microtubules at the branching site. (E) DNA-PAINT image of a 500-nm slice of the microtubule network in SSNA1 over-expressing cells. (F) Zoomed-in view from E - the object is colored in a rainbow code according to the depth. (G) Individually recognized microtubules are highlighted in various colors. 3-way intersections are indicated with red arrowheads. (H-J) Corresponding view of a 500-nm slice of the microtubule network in untreated cells (control). For analysis, 3 independent SSNA1 over-expressing and control cells were assessed each, containing the total microtubule lengths of 5700 μm, 7900 μm and 1900 μm and 7700 μm, 8500 μm, 7700 μm, respectively. See supplementary table 3 for source data.

