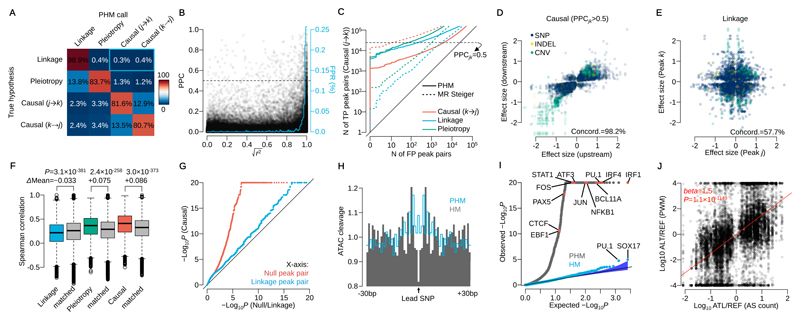
Figure 2. Model performance assessment by simulation and real data.
(A) Confusion matrix of mapped interactions under the 4 hypotheses. Percentages are calculated from peak pairs with posterior probability was greater than 0.5. The blue rectangle highlights the false positive rate (0.7%) for mislabelling linkage as causality. (B) Posterior probability of causality (PPC) versus r2 between two caQTL variants simulated under linkage. The blue line shows the average false positive rate (mislabelling linkage as causality) in 1% r2 bins (area under this curve is 0.7%, equivalent to the blue rectangle in Fig. 2A). (C) Sensitivity and specificity of causal interactions for PHM and MR Steiger in simulated data. The y-axis shows the number of true positive (TP; simulated causal (j→k) model) peak pairs against the number of false positive on the x-axis (FP; simulated under the causal (k→j), linkage or pleiotropy model) peak pairs. The horizontal dashed line illustrates PPCjk=0.5 for PHM. (D) Effect sizes of the lead variant at upstream and downstream peaks in confident causal peak pairs. (E) Effect sizes of two independent caQTLs at peaks in linkage (posterior probability greater than 0.5). Linkage peaks with lead variants with LD index r2>0.25 were used. (F) Distribution of Spearman’s rank correlation coefficient of DNaseI-seq read count across 53 cell types from the Roadmap Epigenomics Project stratified by the mapped interaction categories (Online Methods). Tow-sided t-test was performed with the distance matched control for linkage, pleiotropy and causality, respectively (n=98,963, 12,233 and 15,487 peak pairs). (G) QQ-plot of –log10 P-values for allele-specific accessibility of downstream peak for the high confidence set of 15,487 causal peak pairs (y-axis), and for 15,487 randomly chosen, distance-matched controls where the posterior probability of either null or linkage hypothesis was greater than 0.5 (x-axis). (H) Aggregated ATAC-seq cleavage across 1,577 regions around the lead SNPs detected by pairwise hierarchical model (PHM; grey) and simple hierarchical model (HM; blue line). (I) QQ-plot of Binomial test P-values for 2,570 motifs in CISBP (Online Methods). Blue points correspond to the HM and grey points correspond to the PHM. (J) The ratio of putative TF binding affinities between reference and alternative allele at each lead SNP versus the ratio of ATAC-seq allele-specific (AS) counts (n=14,642 SNPs). AS counts were generated by aggregating only heterozygous individuals at each lead variant. The red line shows the linear regression line.

