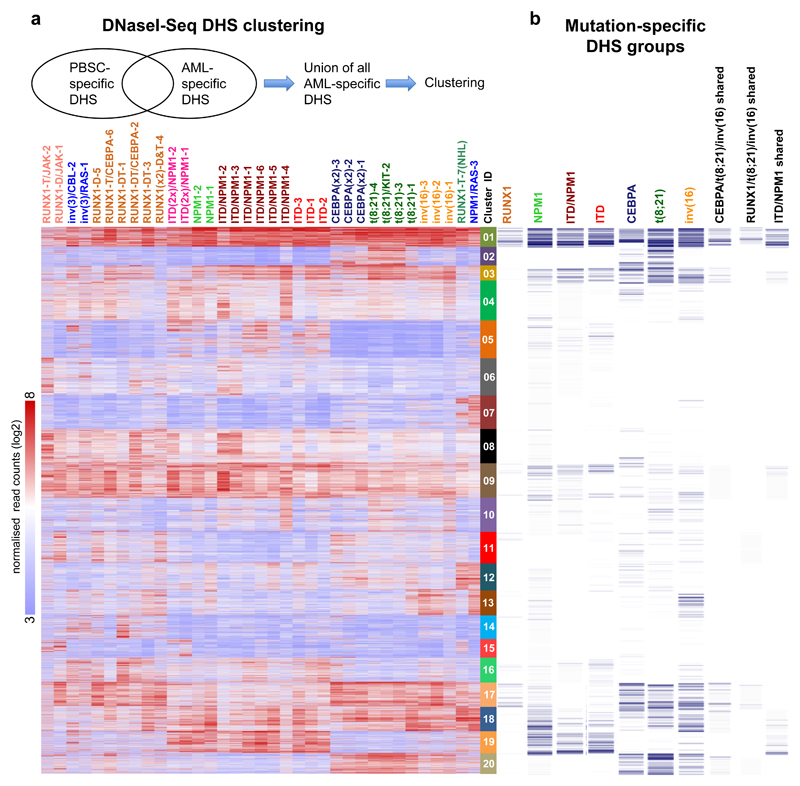
Figure 2. AML-specifically active cis-regulatory elements cluster into common and unique chromatin landscapes.
(a) Heatmap depicting unsupervised K-mean clustering of the DNaseI-Seq log2 signals seen in each AML specific distal DHS peak in each AML sample compared to PBSCs. Clustering was done only on rows (DHS peaks) while samples were ranked based on the clustering in Fig, 1c. The diagram on top of the heatmap shows the DHS peak population used for clustering. (b) Binary heatmap showing the overlap between the clusters from A and the DHSs of the 7 mutation classes which are deregulated compared to CD34+ PBSCs as described in Supplementary Fig 4a.

