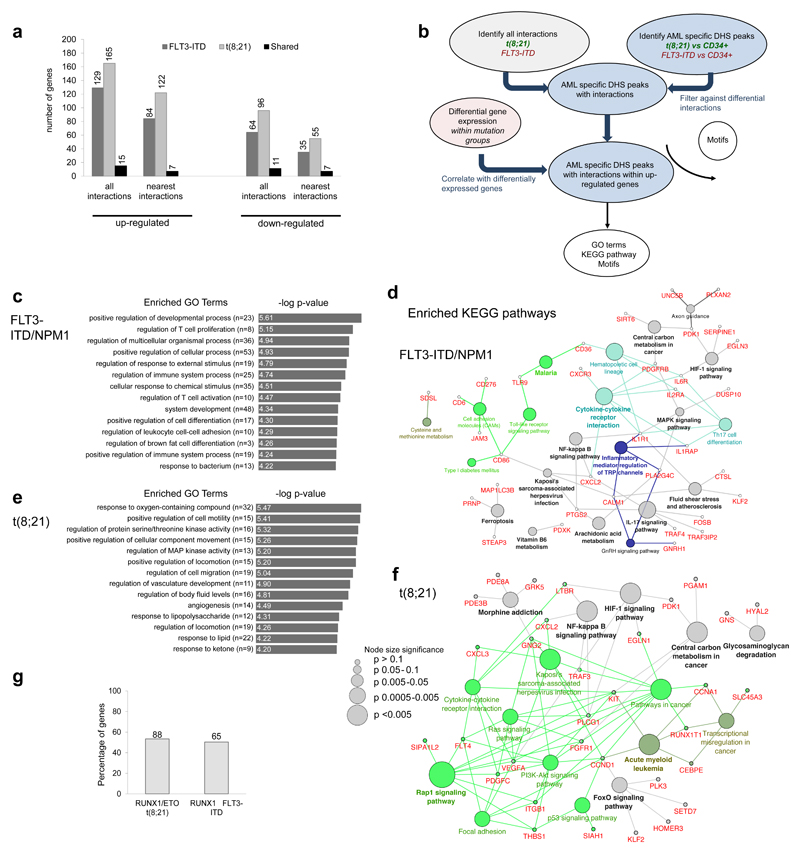
Figure 5. Capture HiC shows differences in locus-specific cis-regulatory interactions between different types of AML and normal cells.
(a) Percentage of up- and down-regulated genes with differential interactions from the FLT3-ITD and the t(8;21) compared to CD34+ PBSCs. The bar figure shows also the percentage of the common genes for the FLT3-ITD and the t(8;21), the number of differentially expressed genes (DEG) is shown on top of each bar. (b) Flow diagram showing the steps for identification of differential interactions and the downstream analysis. (c) Top enriched GO terms for the up-regulated genes of the FLT3-ITD compared to CD34+ PBSCs as outlined in (a). (d) Network diagram of top KEGG pathways for the up-regulated genes of the FLT3-ITD compared to CD34+ PBSCs as outlined in (a). (e) Top enriched GO terms for the up-regulated genes of the t(8;21) compared to to CD34+ PBSCs shown as outlined in (a) Network diagram of top KEGG pathways for the up-regulated genes of the t(8;21) compared to CD34+ PBSCs as outlined in (b). (h): Percentage of RUNX1-ETO and RUNX1 targets amongst up-regulated genes with differential interactions, the exact number of genes is shown above the bars.

