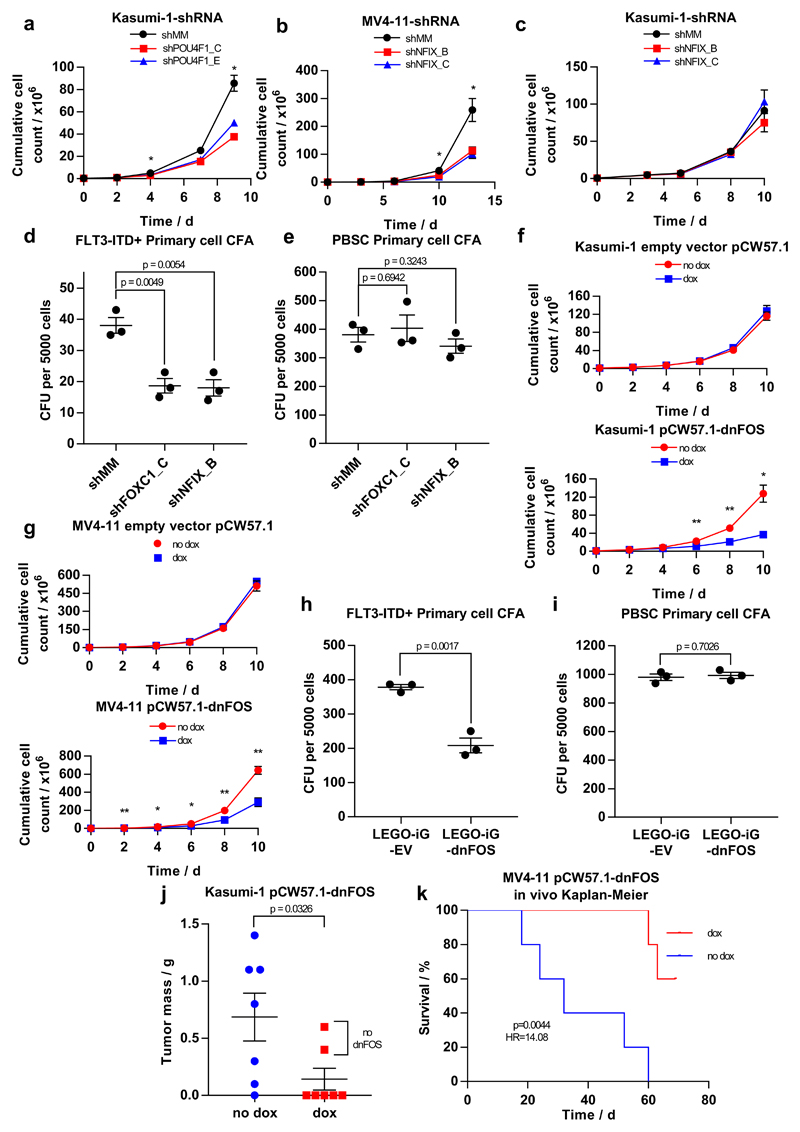
Figure 7. Identification of AML type-specific TFs required for maintaining leukemic growth and colony forming ability.
(a - c) Scatter plot showing the growth curves of (a) Kasumi-1 cells after transduction with shPOU4F1 or (c) shNFIX and (b) of MV4-11 cells after transduction with shNFIX. (d, e) Dot plot showing the number of colonies formed by a FLT3-ITD+ primary AML cell samples (d) or PBSCs (e) after transduction with shRNA targeting FOXC1, NFIX or a mismatch control. (f) Scatter plot showing the growth curve of Kasumi-1 cells transduced with either a doxycycline-inducible dnFOS or an empty vector control with and without 1.5 mcg/ml doxycycline. (g) Dot plots showing the growth curve of MV4-11 cells transduced with either a doxycycline-inducible dnFOS or an empty vector control (right panel) with and without 1.5 μg/ml doxycycline. (h,i) The expression of a dnFOS causes a reduction in the colony forming ability of CD34+ FLT3-ITD+ primary AML cells (H) but not CD34+ PBSCs (i (j) Granulosarcoma formation in RG mice by Kasumi-1 expressing a doxycycline-inducible dnFOS. dnFOS was induced by intraperitoneal injection of doxycycline. (k) Survival curve for RG mice transplanted with MV4-11 cells expressing doxycycline-inducible dnFOS. The induction of dnFOS significantly increased the survival time of mice.
Significance in all experiments was tested using a two-tailed Student’s t-test (n=3) with * p<0.05, **p<0.01 in both samples compared to the mismatch control where indicated. Error bars show standard error of the mean. Further detail on statistical analysis can be found in Online Methods.

