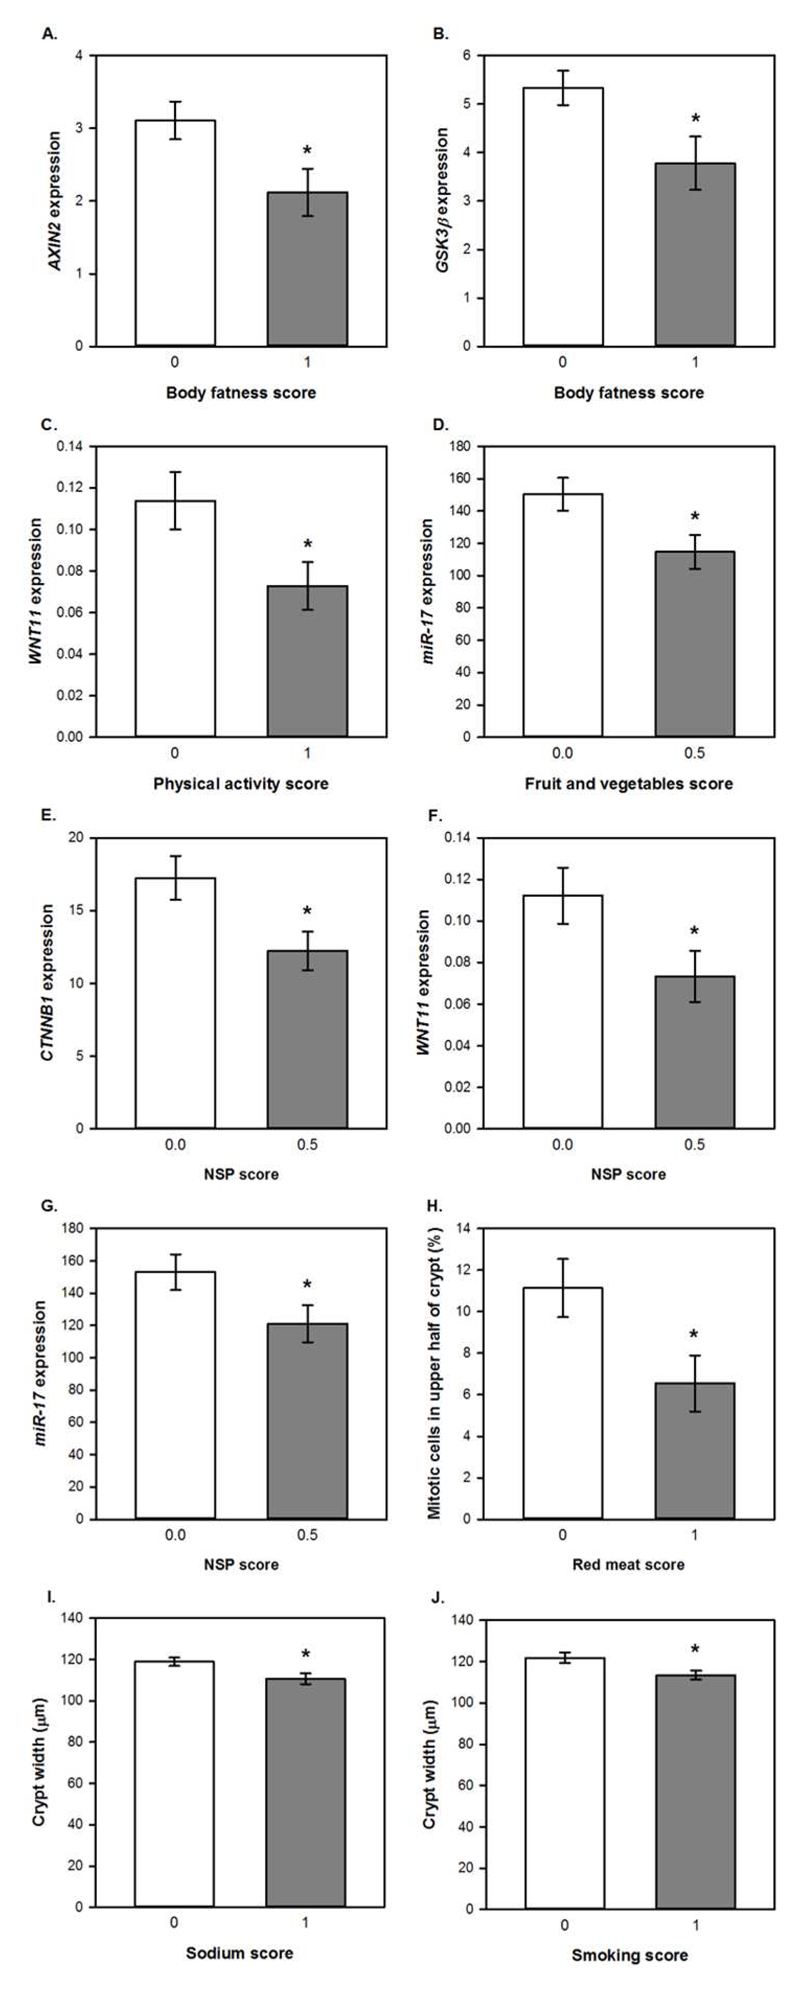
Figure 3. Relationships between adherence scores for individual WCRF/ AICR recommendations and colorectal mucosal biomarkers.
Data are presented as means and error bars represent standard error of the mean. Gene expression data are adjusted copies (2-ΔCt x 10,000) relative to 18S and β2M housekeeping genes. miRNA expression data are presented as adjusted copies (2-ΔCt x 10,000) relative to RNU-6 and SNORD68. * p<0.05 for differences between scores analysed using unpaired t-tests.

