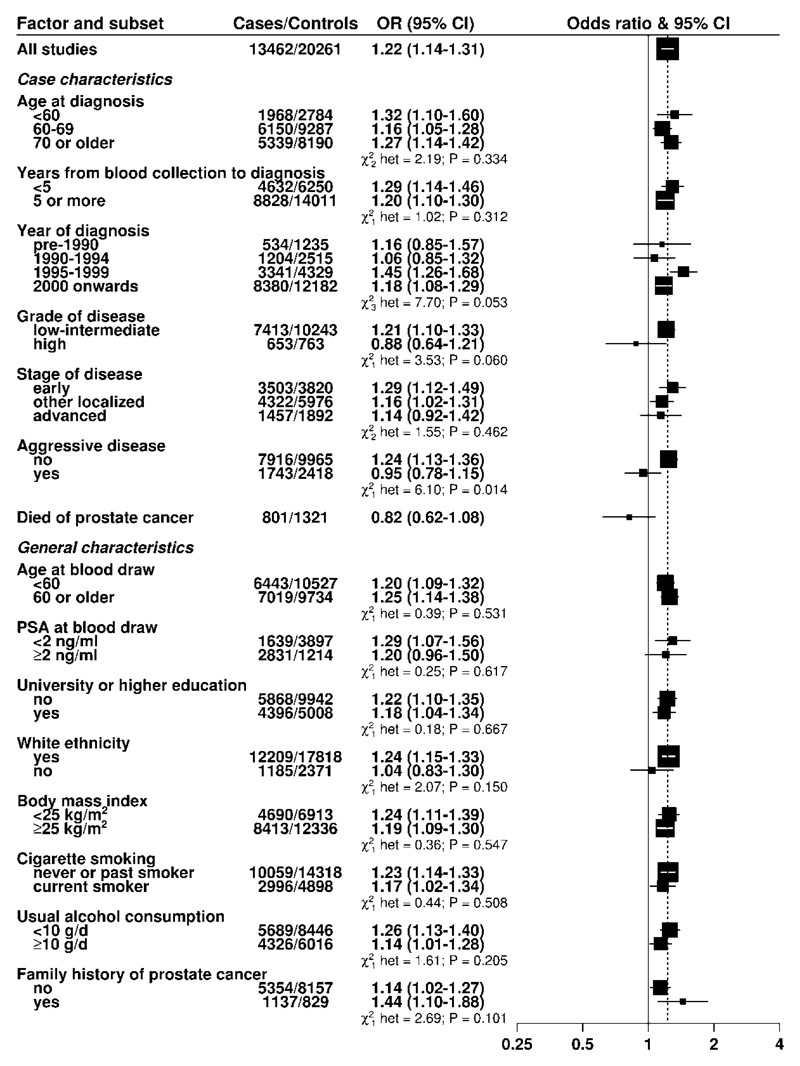
Figure 3. Odds ratios (95% confidence intervals) for prostate cancer associated with a study-specific 80 percentile increase in season-standardised 25-hydroxyvitamin D in prospective studies for selected subgroups.
The odds ratios were conditioned on the matching variables and adjusted for exact age, marital status, education, smoking, height and body mass index. Tests for heterogeneity for the case-defined factors were obtained by fitting separate models for each subgroup and assuming independence of the ORs using a method analogous to a meta-analysis. Tests for heterogeneity for the other factors were assessed with a χ2-test of interaction between the subgroup and continuous trend test variable. Note that the number of cases for each tumour subtype may be fewer than shown in the baseline tables since here the analysis for each subgroup of a case-defined factor is restricted to complete matched sets for each category of the factor in turn; some matched sets contain a mixture of subtypes and while controls are allocated case-defined characteristics in equal proportion to the cases, 25(OH)D may be unknown for some participants, leading to incomplete matched sets.
Stage (early, T1 and/or stage I; other localized, T2/N0/M0 and/or stage II, and advanced, T3-T4/N1/M1 and/or stage III-IV), grade (low-intermediate, Gleason sum was < 8 or equivalent; high, Gleason sum was ≥ 8 or equivalent, and aggressive (T4/N1/M1 and/or stage IV and/or prostate cancer death). White ethnicity (89.4% yes, 10.6% no).

