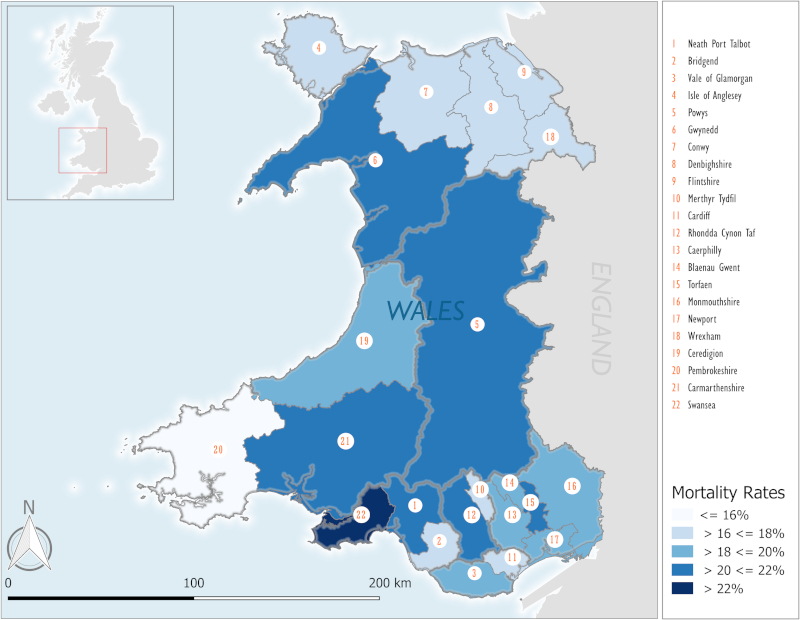
Figure 3. Geographical distribution of deaths during the study period.
Percentage of death: % of patients who died during the entire study period in a Local Authority area. University Health Board boundaries (consisting of 2 or 3 Local Authorities) are depicted as grey borders. Population details of each Local Authority area is provided in Table S8 in the Supplemental Digital Content.

