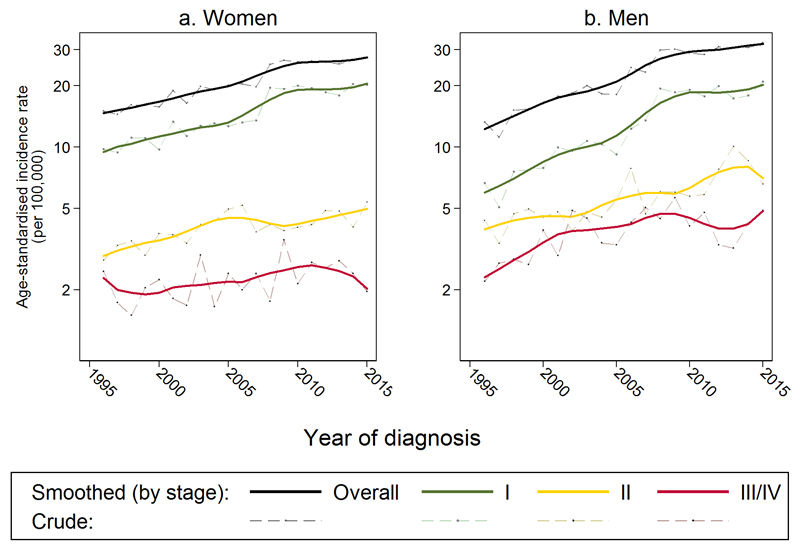
Figure 1.
Age-standardised incidence of melanoma (smoothed and observed) by stage at diagnosis, for a) women and b) men
Smoothed rates are ‘lowess’ (locally weighted scatterplot smoothed) (i.e., the average of each observed yearly rate and rates in nearby years; in this case the bandwidth was set at 0.2). For 493 patients (5% of entire dataset) with missing values on stage, these values were imputed as described under ‘Multiple imputation’.

