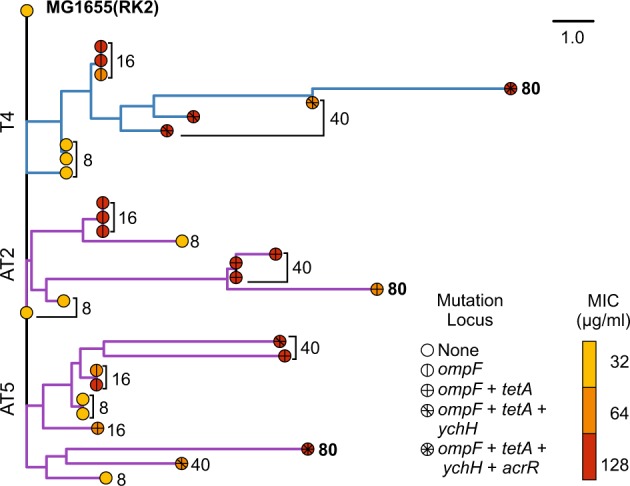
Fig. 1.

Phylogeny of sequenced clones isolated from populations T4, AT2, and AT5 rooted using the ancestral MG1655(RK2). The distance matrix used to produce the tree was constructed from the binary presence or absence of mutations, specific to the nucleotide level, relative to the ancestral strain. The scale bar represents number of mutations. Branch tips are coloured by the MIC of the sequenced clone, tip symbols represent the presence of parallel mutations within the evolved clone. Tips are labelled with the transfer from which the clone was isolated from. Blue branches show the lineage of clone evolved within the tetracycline only treatment, purple branches show two independent populations evolved under tetracycline plus ampicillin treatment. MIC curves for each transfer are presented in Fig. S3. Full genotypes of sequenced strains are available in Table S1
