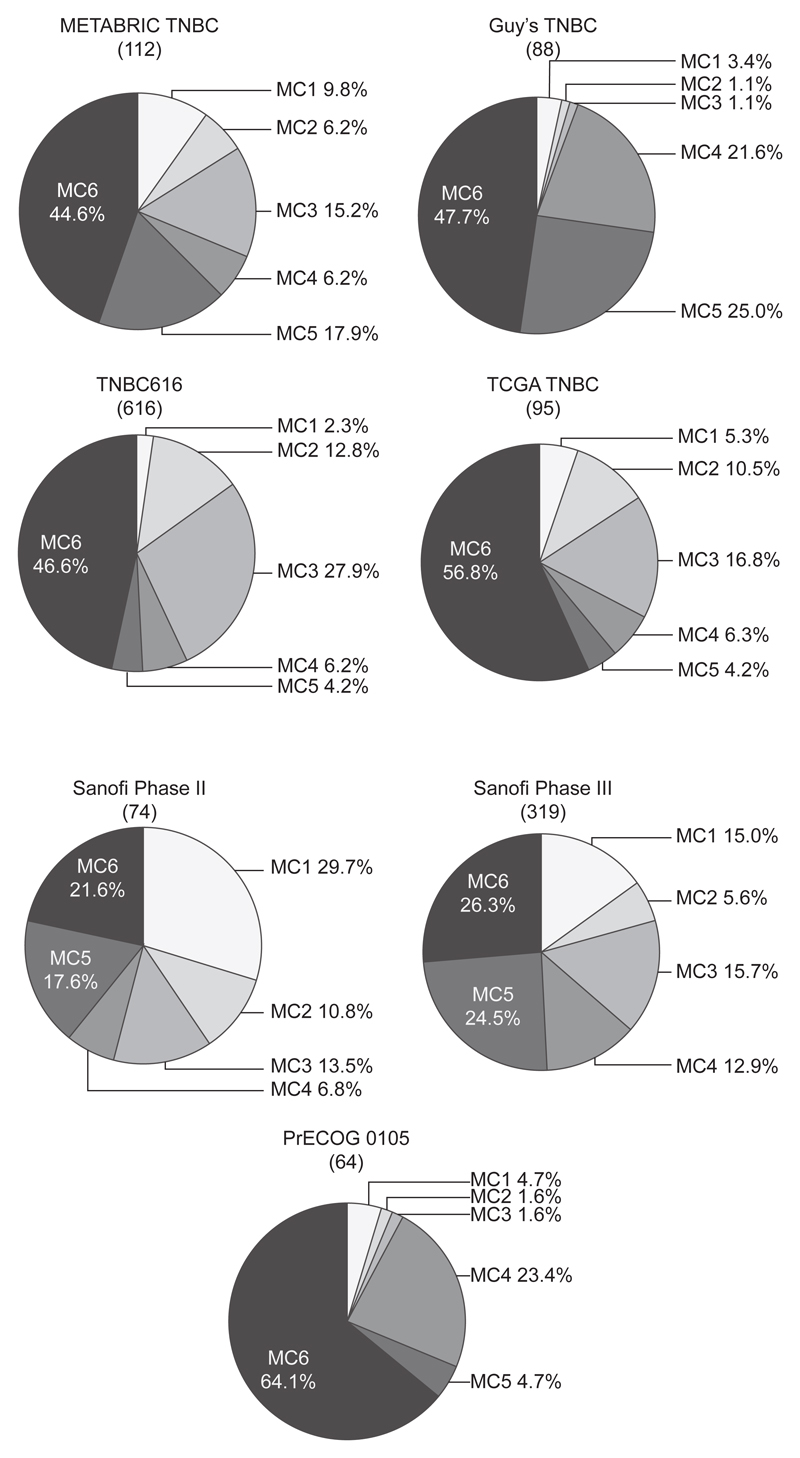
Figure 2.
TNBC cohorts classified using the METABRIC-set 15 four-gene decision tree signature. Pie charts illustrating the proportion of the MC subtypes in four primary invasive TNBC cohorts, namely METABRIC TNBC, Guy’s TNBC, TNBC616 and TCGA TNBC, as well as three clinical TNBC studies, including Sanofi Phase II, Sanofi Phase III and PrECOG 0105. The total number of tumours in each cohort is listed in brackets. The percentage for each subgroup is shown next to the respective pies.

