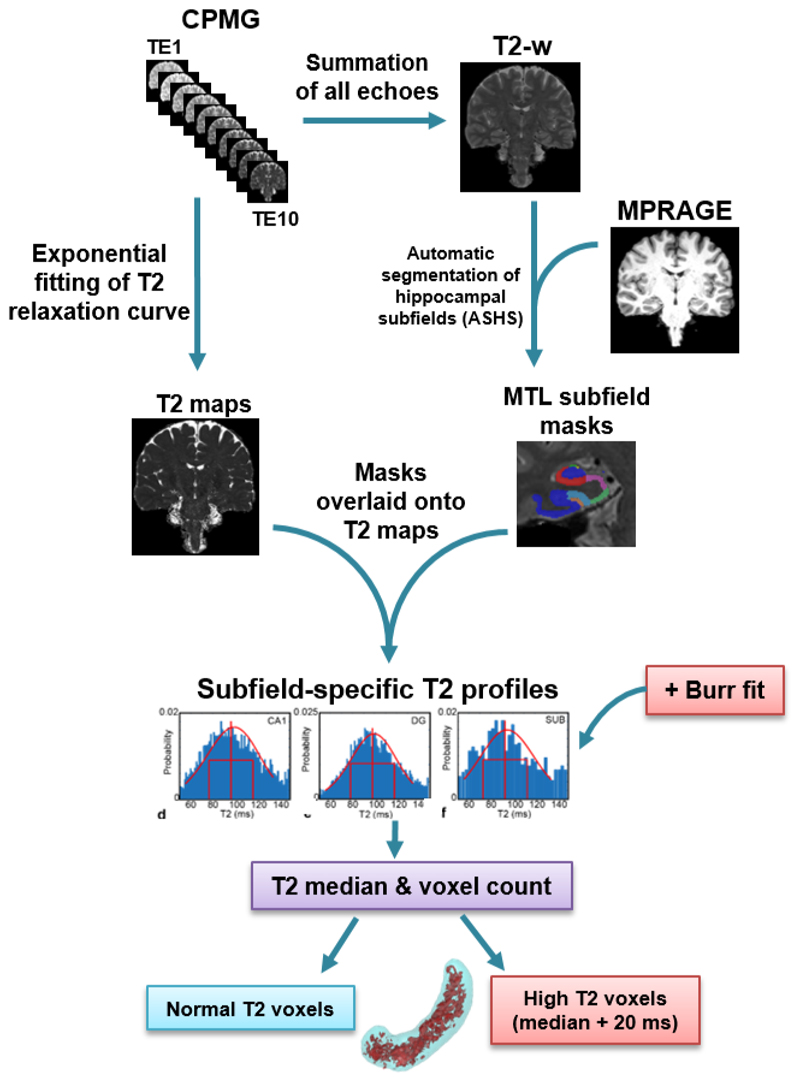
Figure 1.
Flowchart of T2 image data processing. CPMG multi-echo images are used to produce both echo-summed T2-weighted (T2-w) and absolute T2 images (T2 maps). T2-weighted images are used together with T1-weighted MPRAGE images as inputs to the automated segmentation of hippocampal subfields (ASHS) to yield subfield masks. These subfield masks are transferred onto the T2 maps to produce subfield-specific T2 profiles. The T2 profiles are fitted to Burr function to identify normal and high T2 voxels in each subfield. The percentage of high T2 voxels is calculated for each subfield from these data.

