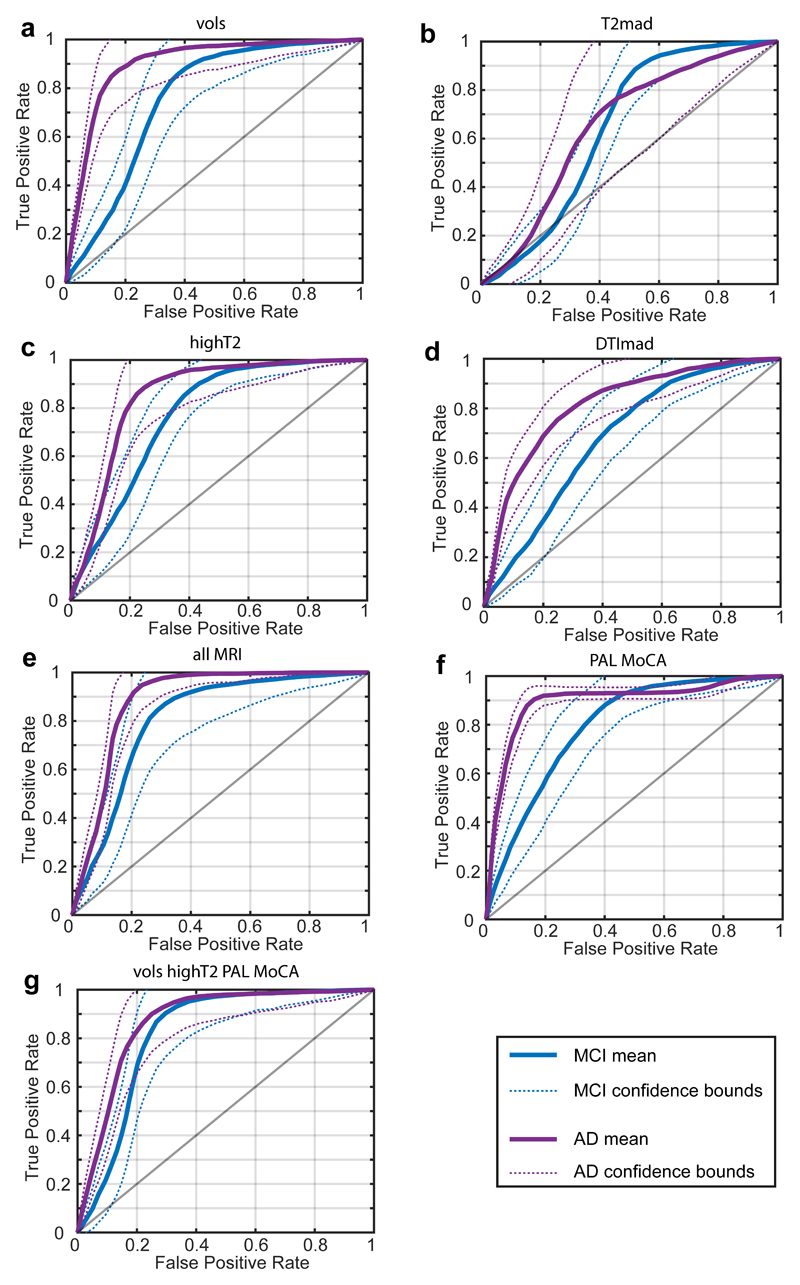
Figure 2.
ROC curves for the classification of aMCI and ADD groups using different sets of MRI and cognitive variables. Panel (a) shown ROC curves for hippocampal subfield and EC volume; panel (b) for T2mad; panel (c) for high T2 fractions; panel (d) for collective indices of DTImad; panel (e) for allMRI indices; panel (f) for cognitive tests, PAL and MoCA and panel (g) for combined MRI volumes, highT2 voxels and cognitive test.

