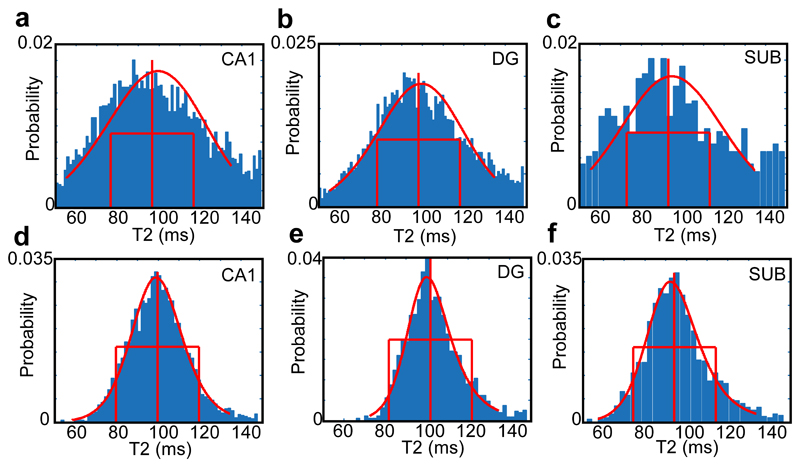
Figure 3.
Distributions of T2 within different hippocampal subfields for an aMCI participant aged 69 (top row) and a younger control participant aged 49 (bottom row). The increasing width and fraction of high-T2 voxels in the older MCI case is clear. The median, 20 ms lines, and the fit of a Burr distribution are shown in red.

