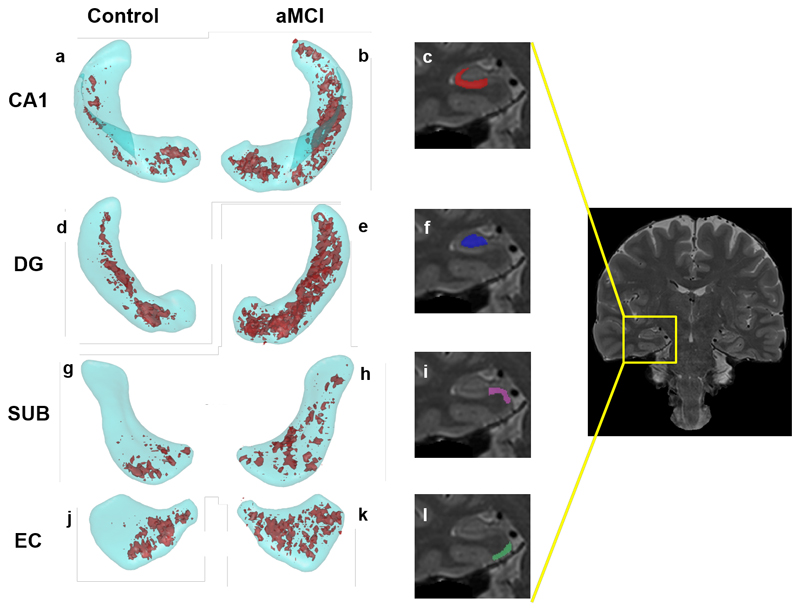
Figure 4.
Locations of high-T2 voxels at the 15% level (15% of participants in the group have a high-T2 value) in the Control (a,d. g, j) and aMCI (b, e, h, k) groups for selected subfields and the EC. The subfields are shown in cyan, the 15% probability high-T2 regions in red. Zoomed sections from the coronal image on the right show a slice through CA1 (c); dentate gyrus (f); subiculum (i) and entorhinal cortex (l).

