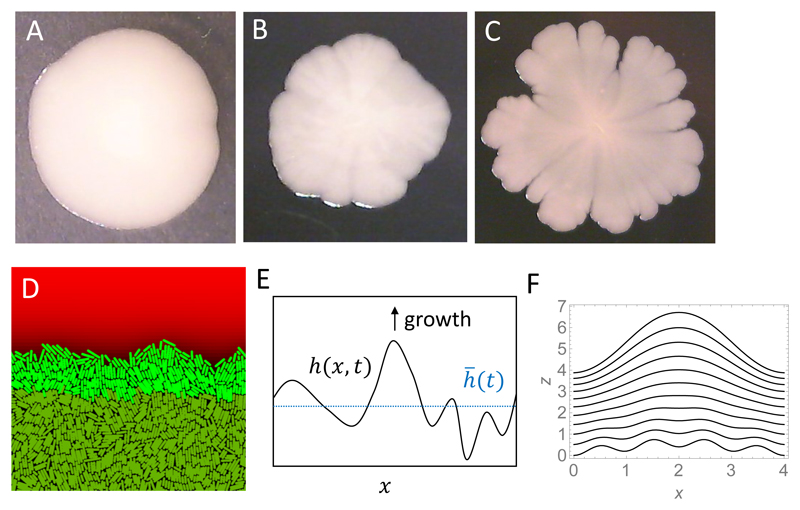
Figure 12.
(A-C) Examples of E. coli colonies (on 2mm-thick, 2% agarose infused with LB) with different roughness of the colony boundary: smooth (A), rough (B), and branched (C). These different shapes have been obtained by using different strains (MG1655 for B, MG1655∆fimA∆fliF for A), or incubating colonies of MG1655 for different amounts of time at 37C (B = short time, C = long time). (D) Boundary of a simulated colony (simulation details as in Ref. [192]). The nutrient concentration is shown as different shades of red (brightest colour = highest concentration). Replicating cells are shown in bright green, whereas stationary cells with no access to nutrients are shown in dark green. (E) Schematic illustration of the model from Eq. (36). (F) Interface profiles h(x, t) obtained by numerically solving Eq. (36) for L = 4, ζ = 0.02, b = 1, f(h) = 1/(1 + e−h), and t = 0, … , 10. The initial condition is a superposition of two sine functions with periods 4 and 1. The oscillation with period 1 is damped whereas the one with period 4 grows in time.

