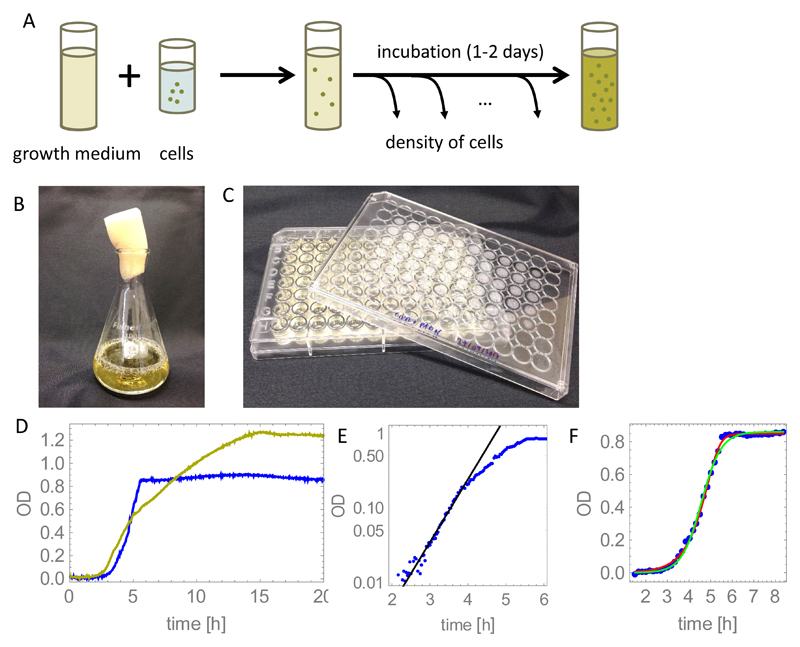
Figure 2.
(A) Sketch of a typical batch culture bacterial growth experiment. (B-C) Containers used to grow bacteria: a large-volume flask (100ml), and a microtiter plate with 96 individual culture wells of volume ~ 400μl. (D) Measured growth curves for E. coli strain MG1655 in simple- (“rich” MOPS: glucose, aminoacids, nucleotides, salts (blue curve)) and complex-nutrient medium (LB broth, yellow curve). "OD" is a measure of the turbidity of the suspension; see footnote to main text. The MOPS medium was created by mixing 100ml M2101, 100ml M2103, 200ml M2104 (Teknova), 10ml 0.132M K2HPO4, 1g glucose, and double-distilled, autoclaved water to a total volume of 1000ml. The LB medium consists of 25g of LB powder (Fisher): tryptone, yeast extract and NaCl, dissolved in 1000ml of distilled water and autoclaved. 200μl of the medium was added to each well of a 96-well plate (panel C), inoculated with 1μl of PBS-washed overnight culture of E. coli, and incubated at 37C in a BMG FLUOstar plate reader for 24h. OD was measured every 2mins with shaking for 20s prior to each measurement. (E) The exponential growth model (Eq. (5), black curve) fits the experimental MOPS curve from panel D for low bacterial densities. Fitting to the data in the range t = 1.5 … 3.5h gives an exponential growth rate r = 1.94h−1. (F) Comparison between different models and an experimental growth curve for growth in rich MOPS: the logistic growth model (Eq. (7)) is shown by the green line and the Monod growth model (Eq. (10)) is shown by the red line. The best-fit maximum growth rate is 2.2h−1 (logistic growth) and 2.1h−1 (Monod growth).

