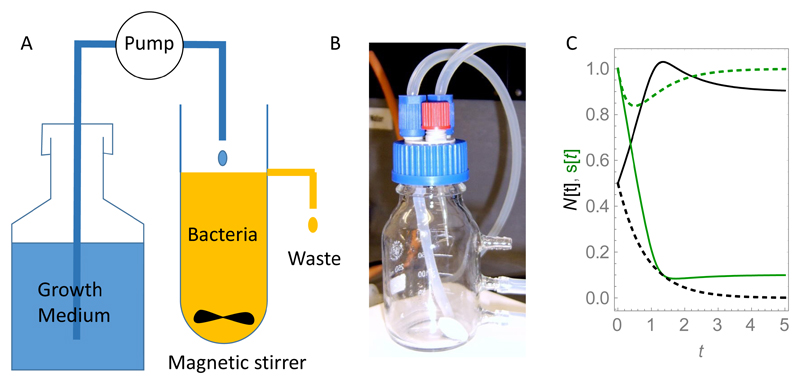
Figure 3.
(A) Schematic illustration of a chemostat. (B) Photograph of a simple chemostat consisting of a glass flask with tubing for media delivery, aeration, and waste removal, and a magnetic bead for stirring the flask contents. (C) Example curves N(t), s(t) (black and green, respectively), obtained by numerical simulation of Eqs. (11) and (12) for γ = 1, Ks = 0.1, s0 = 1, rmax = 2 and d = 1 (solid lines) and d = 3 (dashed lines). The simulations are initiated with N(0) = 0.5 and s(0) = 1 (in arbitrary concentration units). dcrit = 1.82 for this set of parameters. For the solid lines, d < dcrit and a stable bacterial population is maintained in the chemostat (the solid black line reaches a non-zero steady state); for the dashed lines, d > dcrit and the population is “washed out” (the dashed black line goes to zero).

