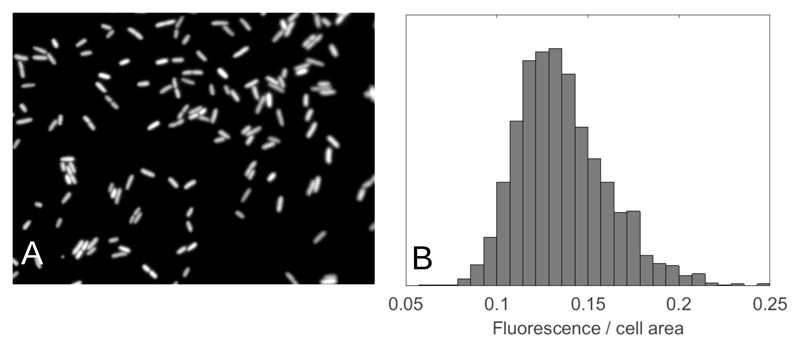
Figure 5.
E. coli cells show variability in the expression of a gene encoding a fluorescent protein. A population of E. coli cells (strain RJA003, created by P1 transduction from strain MRR [13] into MG1655) was grown in a 1 litre chemostat with dilution rate 0.5h−1 on Evans media [128] supplemented with 50mM glucose. The bacteria expressed cyan fluorescent protein (CFP) from a constitutive (unregulated) promoter (the PR promoter from phage λ). After sampling from the chemostat, cells were kept on ice for ~ 1h prior to being spread on the surface of a 1% agarose pad and imaged in an epifluorescence microscope. (A) Fluorescence image in the CFP channel showing that individual cells show different levels of fluorescence. (B) Histogram of fluorescence intensities per area, obtained from analysis of many such images (units are arbitrary). The width of the histogram, relative to the mean, provides a measure of the population heterogeneity in gene expression. Data shown courtesy of Joost Teixeira de Mattos, Alex ter Beek, Martijn Bekker and Tanneke den Blaauwen.

