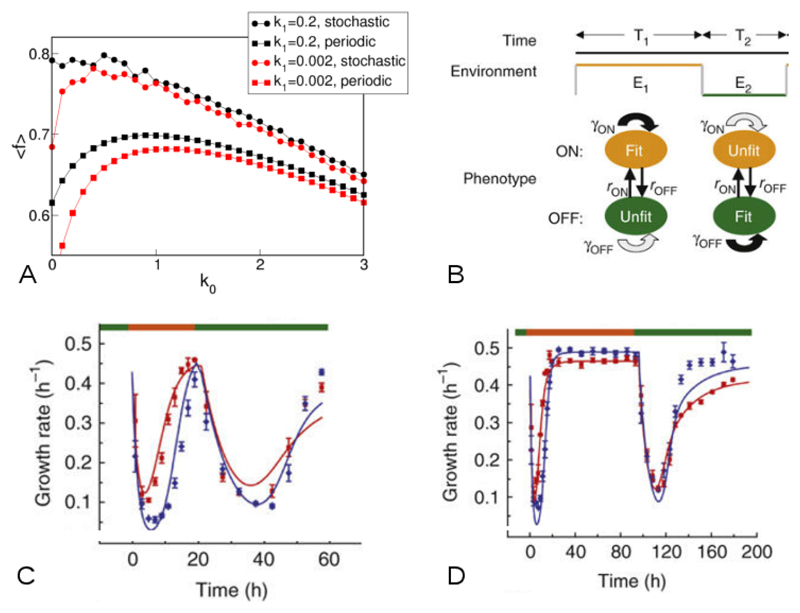
Figure 6.
(A) Predicted average value of f as a function of the rate k0 of switching into the less favourable state 0. These results were obtained by numerical solution of Eq. (26), for an environment that switches stochastically as a Poisson process (with average rate 1), or periodically (once per time unit). When the environment switches, we set f → 1 − f in the simulation, keeping all other parameters fixed. When the rate k1 of switching into the faster growth state is very small, the function 〈f(k0)〉 is peaked at a non-zero value of k0, implying that it is favourable for cells to switch into the slower growth state at some non-zero rate, whether the environment is stochastic or periodic. However for the larger value of k1 simulated here, switching into the slower growth state is favourable only in the periodic environment. For even larger values of k1, switching becomes unfavourable even in the periodic environment [140]. (B-D) Experiments with a stochastically switching strain of yeast cells, performed by Acar et al. [146] (images reproduced from Ref. [146]). (B) Schematic illustration of the experimental setup. Yeast cells can be in either of two states, labelled ON and OFF. Cells randomly switch between the states at rates rON and rOFF which can be tuned by the experimenter. The environment is maintained in state E1 for time T1 before being switched to state E2, which is maintained for time T2. The proliferation rates γ of the two cell types depend on the environment; the ON cell type proliferates faster in E1 while the OFF cell type proliferates faster in E2. (C-D) Growth rates measured as a function of time during such an experiment, for cells that switch fast (red; rON ~ 0.047h−1, rOFF ~ 0.035h−1) or slow (blue; rON ~ 0.004h−1, rOFF ~ 0.007h−1). Panel C shows results for an experiment with T1 = 20h, T2 = 37h; here the fast-switching cells have on average a higher growth rate. Panel D shows results for T1 = 96h, T2 = 96h; here the slow-switching cells have a higher growth rate on average.

