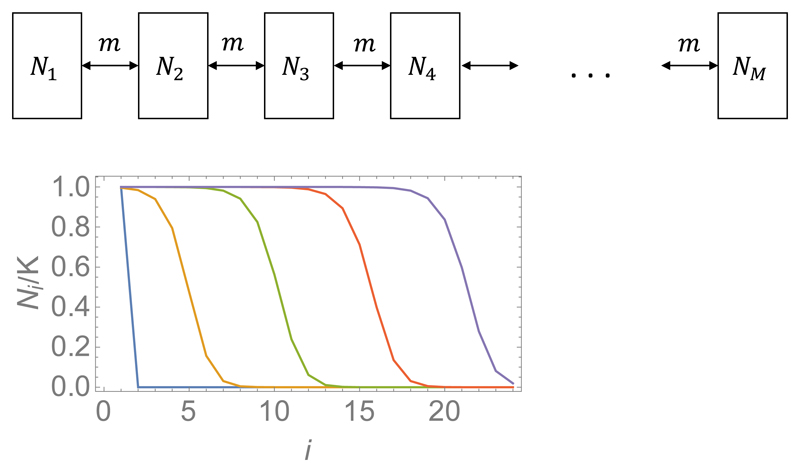
Figure 9.
Top: Schematic illustration of a model in which a spatially structured bacterial population is represented as a chain of well-mixed sub-populations connected by migration. In this model, bacterial growth in each compartment is assumed to follow the logistic model (Eq. (7)), and the migration rate per bacterium between neighbouring compartments is assumed to be a constant, m. Bottom: The model predicts the emergence of travelling waves of bacteria. The plot shows the results of numerical simulations of Eq. (28), for M = 24, r = 1, m = 0.1 and any K > 0, in which bacteria are initially present only in compartment i = 1. The curves correspond to times t = 0, 7.5, 15, 22.5, 30 (from left to right).

