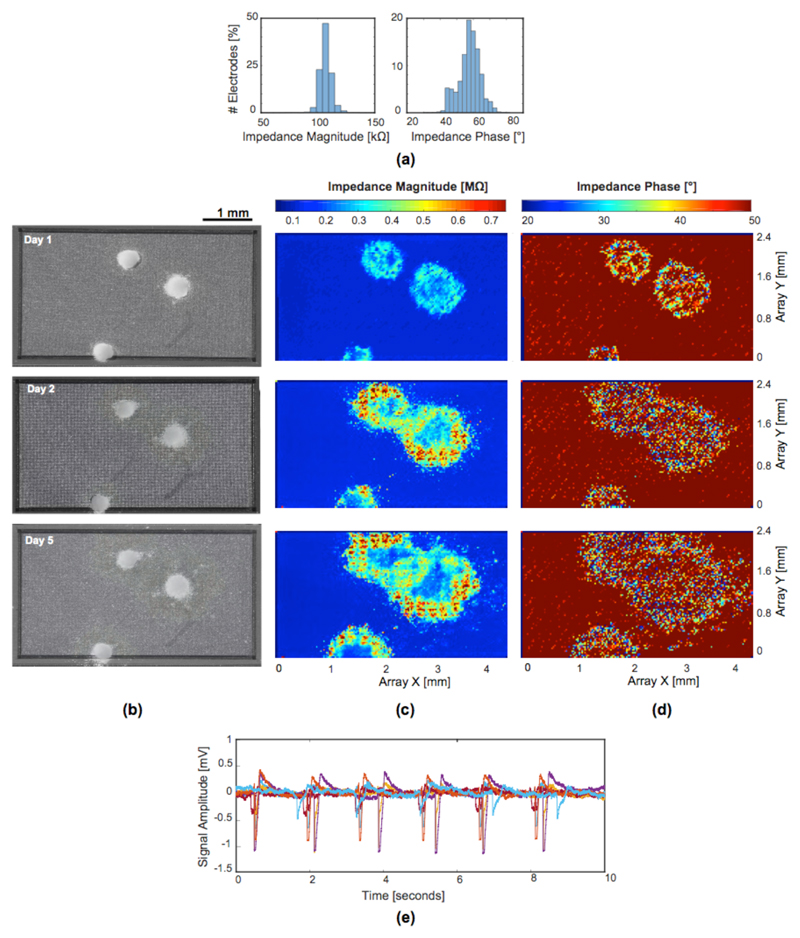
Fig. 11.
Embryoid bodies (EBs) were placed onto the MEA surface, and EIS measurements were performed after cell placement. Pt-black-covered electrodes with a size of 3×7.5 μm2 were used for the bio-experiments. (a) Impedance magnitude and phase distribution of all electrodes at 10 kHz, measured in PBS before the bio-measurement. (b) Microscope images taken five days after the beginning of EB formation and on the 1st, 2nd, and 5th day of EB placement on the chip. (c) Plots of the impedance magnitude values, measured by the full array of electrodes (56,320 electrodes were used in 1760 electrode configurations) on the same days, covering initial cell attachment until full EB adhesion. (d) Corresponding impedance phase values. (e) Electrophysiological recordings (cardiac beating) of the differentiated EBs measured through several electrodes after 5 days of adhesion and culturing on the chip.

