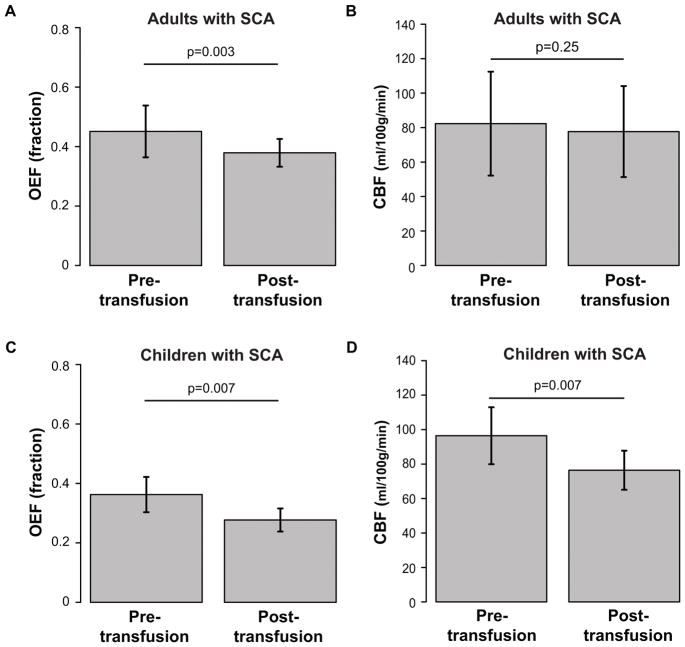
Figure 4. Physiological changes.
Bar graphs of mean oxygen extraction fraction (OEF; left) and cerebral blood flow (CBF; right) are shown in adults with SCA (top) and children with SCA (bottom) from pre- and post-transfusion scans. Error bars represent one standard deviation. OEF significantly (n=16; p<0.001) reduces post-transfusion compared to pre-transfusion in adults with SCA (n=16; p=0.003) (A) and in children with SCA (n=10; p=0.007) (C); CBF remains unchanged on average in adults with SCA (n=14; p=0.25) (B) but significantly reduces post-transfusion in children with SCA (n=10; p=0.007) (D).

