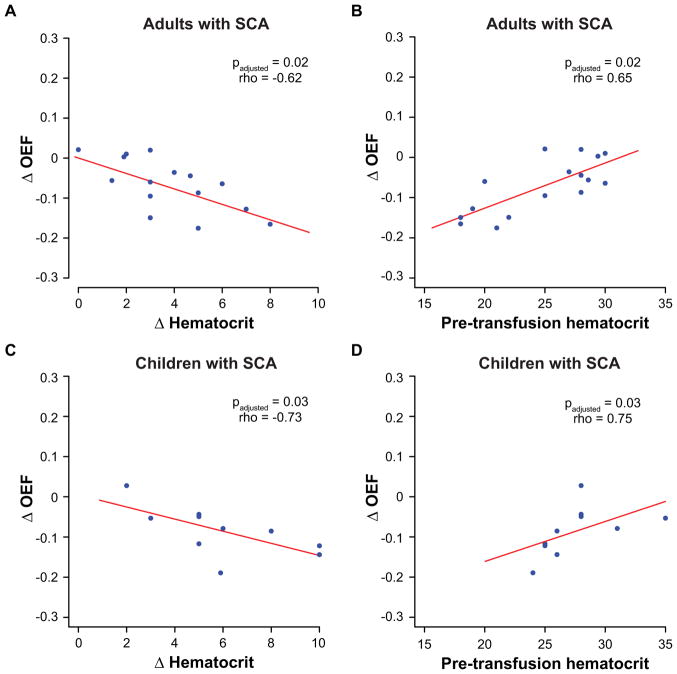
Figure 5. Associations with hematologic variables.
Scatter plots are shown comparing the change in oxygen extraction fraction (OEF) (post-pre) versus change in hematocrit (A) and pre-transfusion hematocrit (B) in adults with SCA (top); similar plots comparing change in OEF in versus change in hematocrit (C) and pre-transfusion hematocrit (D) are also shown for children with SCA (bottom). Spearman’s correlation testing was performed, and the appropriate p- and rho-values are reported for each comparison after correction for false discovery rate. Lines-of-best-fit (red) are shown for each comparison simply as an aid to visualize the direction (direct or inverse) of the trends between variables. In adults with SCA (n=16), the change in OEF is significantly associated with the change in hematocrit and with pre-transfusion hematocrit; these correlations are also seen in children with SCA (n=10).

