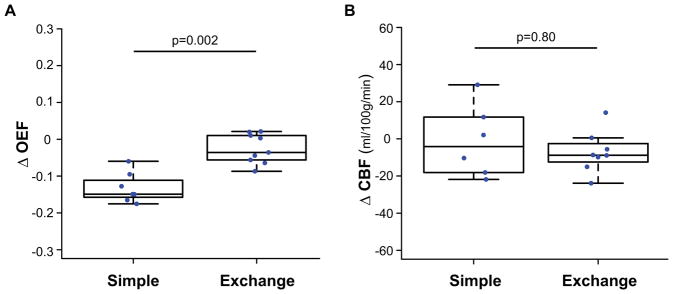
Figure 6. Transfusion type.
Box plots of the change in OEF (A) and CBF (B) are shown for adults with SCA receiving simple transfusions and exchange transfusions. Changes in OEF following transfusion were significantly (p=0.002) greater in those receiving simple transfusions (n=7) versus those receiving exchange transfusions (n=9) (A). No such differences were observed in CBF between adults with SCA receiving simple transfusions (n=6) and exchange transfusions (n=8) (B).

