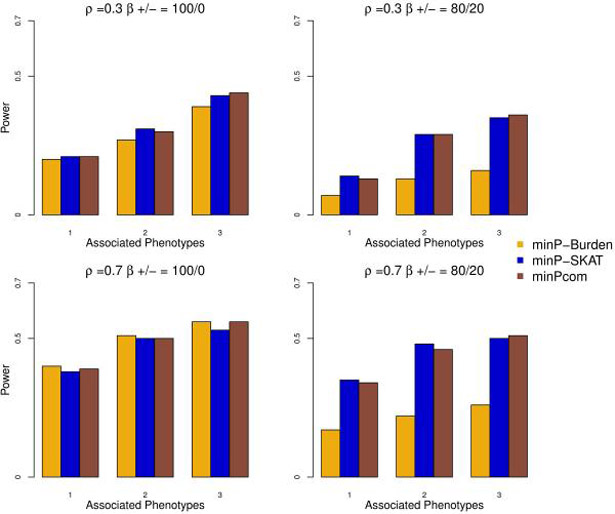
Figure 3:
Power for Multi-SKAT by combining tests with ΣP as Hom, Het, PhC, PC-Sel and ΣG as SKAT and Burden when phenotypes have compound symmetric correlation structures. Empirical powers for minP-Burden, minP-SKAT and minPcom are plotted against the number of phenotypes associated with the gene of interest with a total of 5 phenotypes under consideration. Upper row shows the results for ρ = 0.3 and lower row for ρ = 0.7. Left column shows results when all the causal variants were trait-increasing variants, and right column shows results when 80%/20% of the causal variants were trait-increasing/trait-decreasing variants.

