
Figure 1.
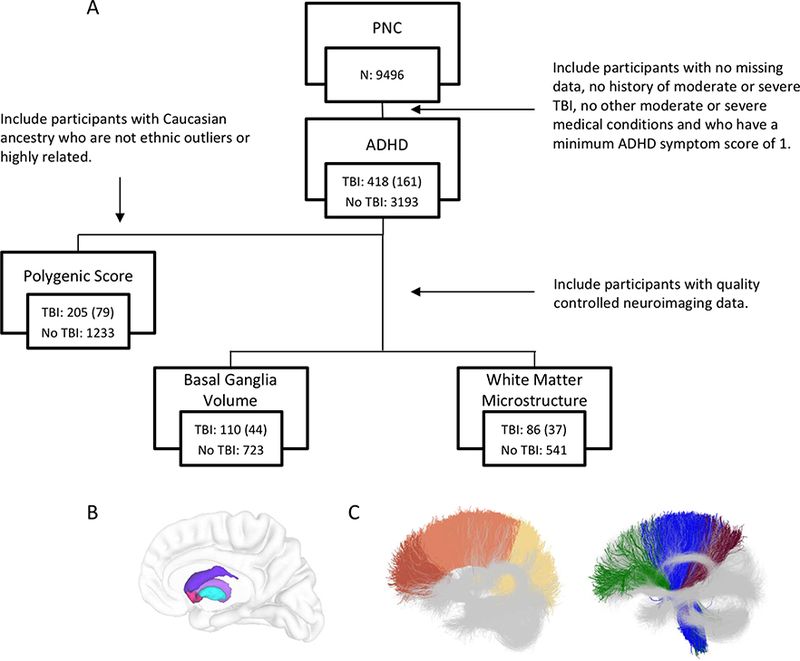
Summary of analyses. A) Eligible participants from Philadelphia Neurodevelopmental Cohort (PNC) were identified for each analysis from the total sample, first for ADHD symptom comparison between TBI groups, second for polygenic score analysis, third for basal ganglia volume analysis and forth for white matter microstructure analysis based on specific inclusion criteria summarized here and described in the Methods section. ‘TBI’ indicates number of youth with a history of mild TBI that were included in that specific analysis with the number in brackets indicating the number of these youth that were considered high risk for persistent deficits following mild TBI. ‘No TBI’ indicates the number of youth with no history of TBI included in that analysis. B) Basal ganglia regions of interest for volumetric analyses are visualized in the right hemisphere embedded in a cortical surface representation for reference: caudate (purple), putamen (violet), accumbens (pink), and globus pallidus (turquoise) C) White matter tract atlases show subdivisions examined in the corpus callosum (left): genu (red), body (orange), and splenium (yellow) and corona radiata (right): anterior (green) superior (blue) and posterior (maroon).