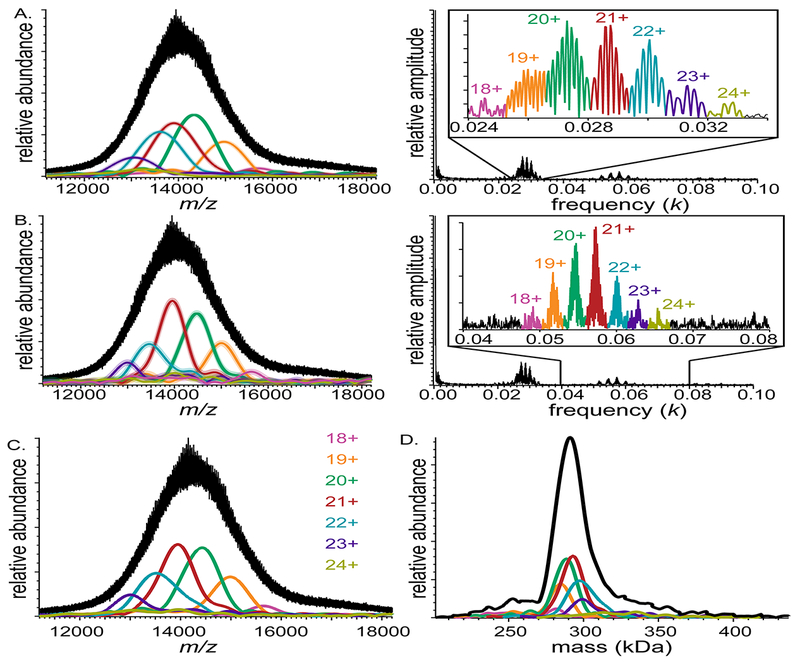
Figure 5.

Mass spectrum of DPPC-MSP1E3D1 Nanodiscs acquired on a QTOF mass spectrometer (left) and corresponding Fourier spectrum (right) for (A) fundamentals and (B) second harmonics. IFT of the charge-state specific peaks in Fourier spectra (insets) are shown as overlaid envelope functions of the same color in mass spectra. Faint color surrounding envelope functions represents uncertainty of envelope functions calculated from average noise amplitude in the Fourier domain. (C) Harmonic-averaged reconstruction of envelope functions. (D) Zero-charge spectrum (black), calculated from harmonic-averaged spectra for all charge states
