
Figure 6.
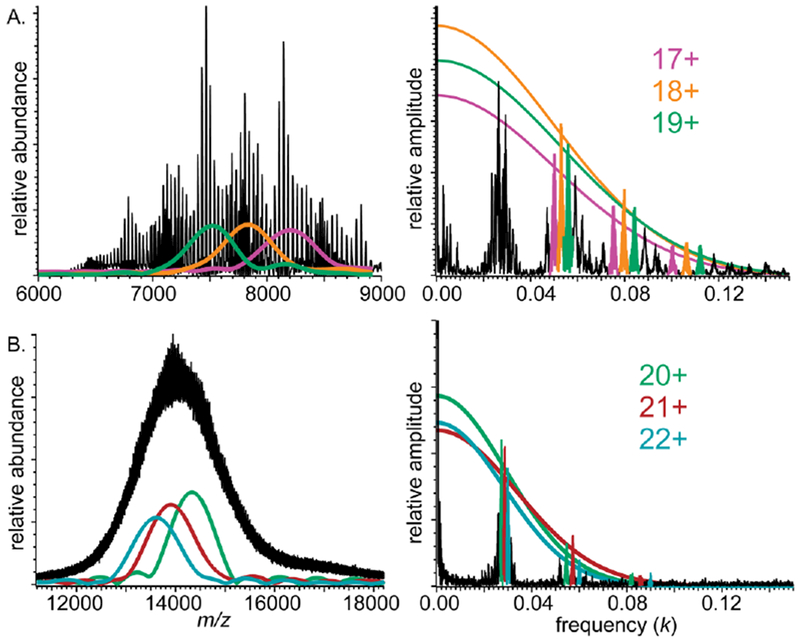
Mass spectra (left) and corresponding Fourier spectra (right) of (A) DMPC-MSP1D1 Nanodiscs acquired using an Orbitrap mass spectrometer and (B) DPPC-MSP1E3D1 Nanodiscs acquired using a QTOF mass spectrometer. Charge-state-specific mass spectral envelope functions (left), and Gaussian frequency decay functions (P(k), right) are shown with same color