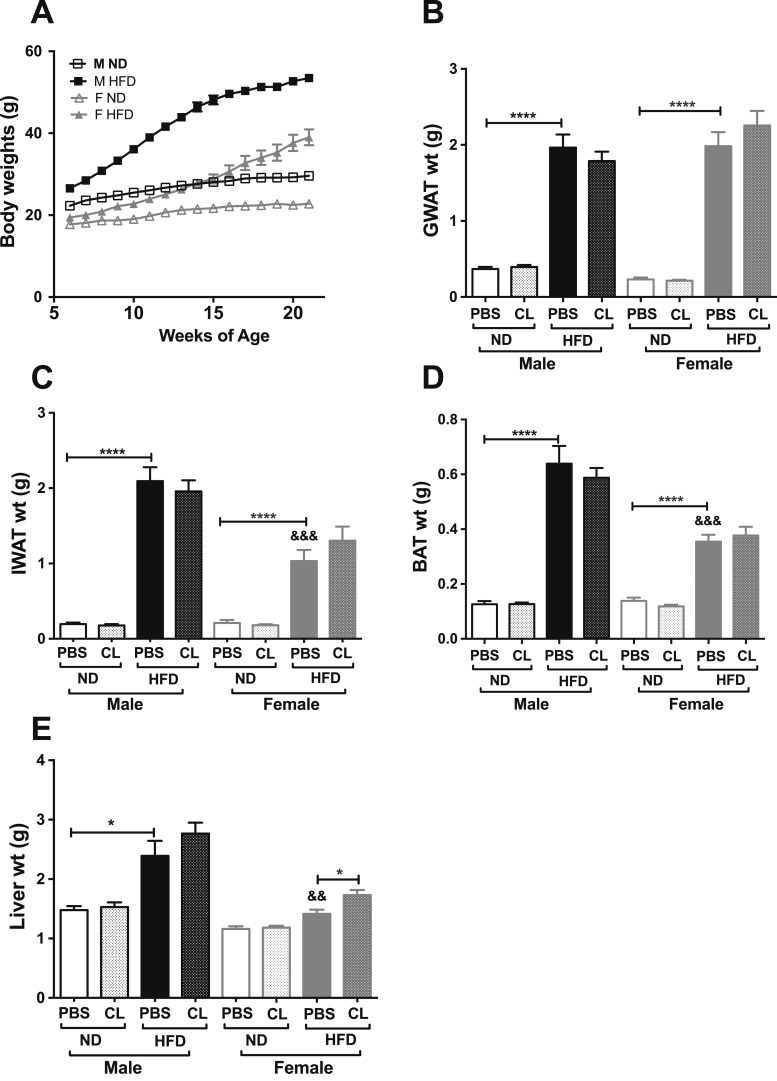
Figure 1.
Sex differences in total body adiposity and tissue weights in response to HFD feeding and CL treatment. (A) Weekly body weights of C57BL6/J male and female on ND or 60% HFD starting at 6 wk of age up to 16 wk. (B) GWAT weight. (C) IWAT weight. (D) BAT weight. (E) Liver weight. n = 7 to 12 per group; error bars are SEM. *P < 0.05; ****P < 0.0001. Comparisons of male HFD PBS vs female HFD PBS are shown as &&P < 0.01 and &&&P < 0.005. F, female; M, male.

