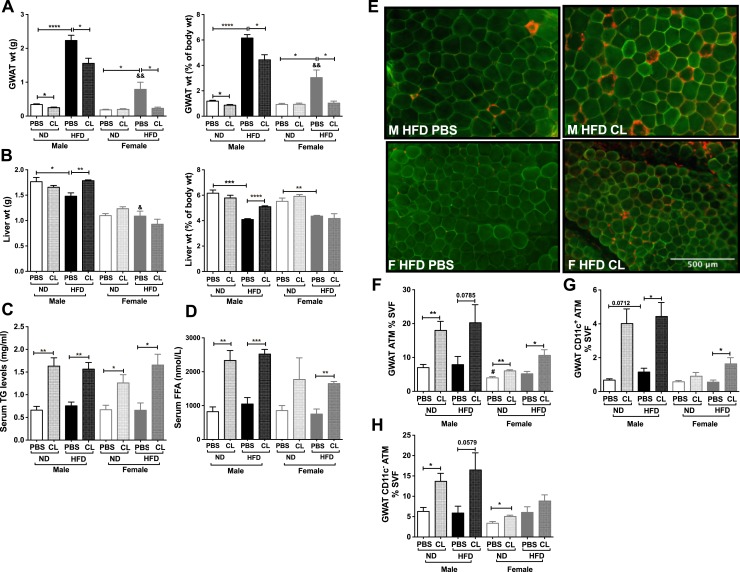
Figure 7.
Adiposity and inflammation in response to chronic CL treatment and short-term HFD. (A) GWAT weight as percentage of body weight. (B) Liver weight as percentage of body weight. n = 4 per group. *P < 0.05; **P < 0.01; ***P < 0.005; ****P < 0.0001. (C) Serum TG and (D) serum FFA in male and female mice after PBS and 3-d CL injection and 6-wk HFD. (E) Immunofluorescence images depicting CLS labeled for caveolin (green) and Mac2 (macrophages, red) in 6-wk HFD-fed male and female GWAT with and without CL treatment. Scale bar, 500 μm. (F–H) Quantitation of (F) GWAT percentage ATMs, (G) GWAT CD11c+ ATMs, and (H) GWAT CD11c− ATMs. n = 4 per group. *P < 0.05; **P < 0.01; ***P < 0.005; ****P < 0.0001. Male HFD PBS vs female HFD PBS are shown as &P < 0.05 and &&P < 0.01. Comparisons of M ND PBS vs F ND PBS are shown as #P < 0.05. F, female; M, male.

