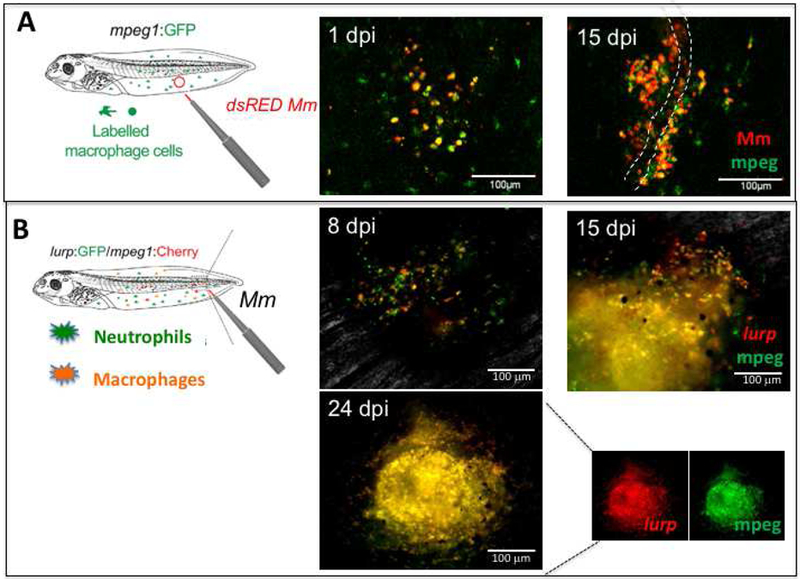
Figure 3. Mm-Tg infection model to visualize immune cells during Mm infection in X. laevis tadpoles.

(A) dsRED Mm (6 ×10⁵ CFU in 1 μl volume) was injected into the muscle tail of mpeg1:GFP tg tadpoles, then infiltration of mpeg1+ macrophage (green) and Mm-infected macrophages (red+ green+) were monitored in live tadpoles at 1 and 15 dpi by confocal microscopy (stage 53). The white dashed line indicates a lining of blood vessels. (B) Granuloma-like structure visualized by using double tg tadpoles (lurp:gfp/mpeg1:mCherry). The tg tadpoles visualize the two subsets of immune cells, neutrophils as green (mpeg1+) and macrophages as yellow or orange (lurp+ mpeg+). The intravital images were taken at 8, 15, and 24 dpi under a conventional fluorescent microscope. An unmerged picture of the granuloma-like structure at 24 dpi in a single channel to visualize mCherry only and GFP only signals are shown. Scale bars are presented as a white solid line. Image were taken under FV1000 Olympus Laser Scanning Confocal Microscope for (A), and Axiovert 200 inverted fluorescent microscope for (B).
