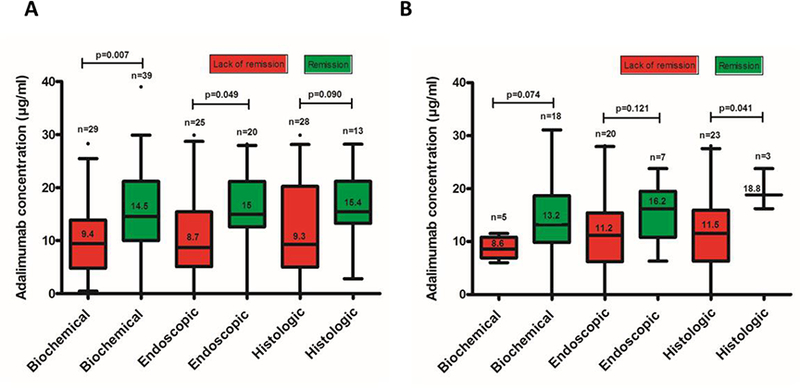
Figure 1.

Distribution of serum adalimumab concentrations during maintenance therapy based on biochemical, endoscopic or histologic remission in patients with Crohn’s disease (A) and ulcerative colitis (B). Box plots (5–95%) show the median (solid line within box), interquartile range (upper and lower box boundaries), standard deviation (whiskers) and outliers (black dot).
