
Figure 2: Group-based Trajectories of Risk Behavior.
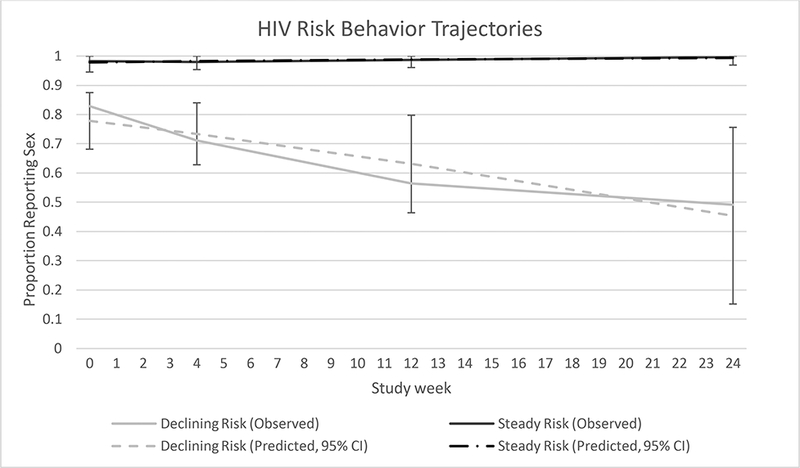
Over the first six months of PrEP use two risk behavior trajectories were identified based on reported sexual activity. Dotted lines represent the predicted values from the models; solid lines represent the observed data.