FIGURE 3.

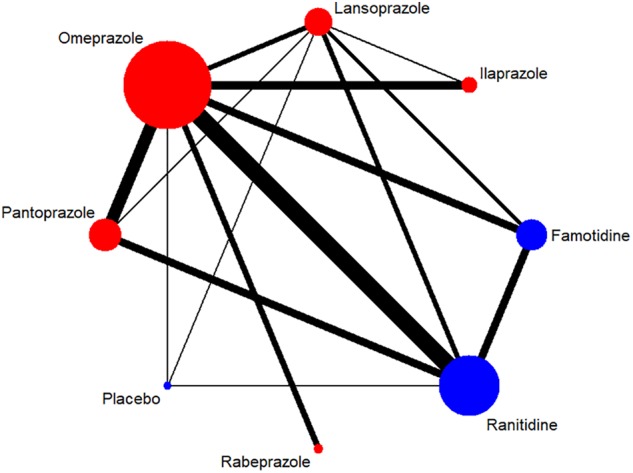
Network of included RCTs with available direct comparisons for adverse events. The widths of the lines indicate the number of included trials.

Network of included RCTs with available direct comparisons for adverse events. The widths of the lines indicate the number of included trials.