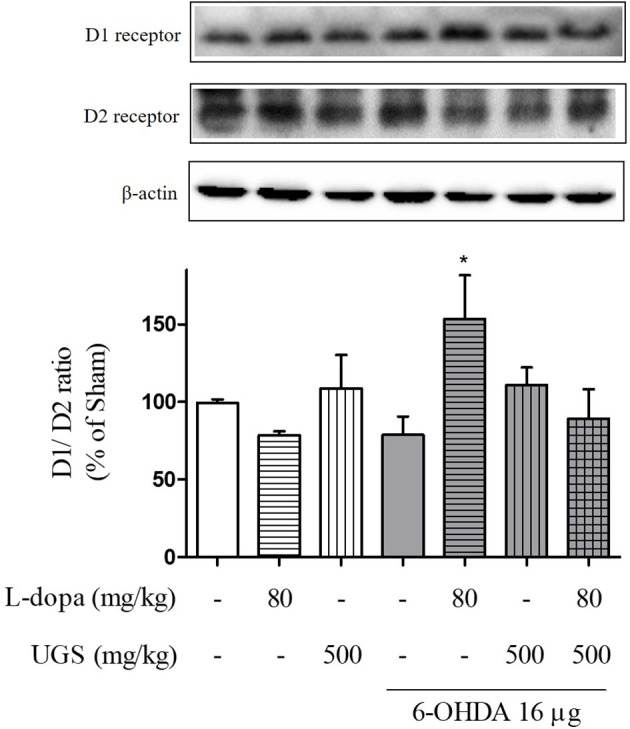
Figure 4.

UGS regulated the L-dopa-induced alterations in the expression of dopamine receptors in 6-OHDA-injected mouse ST. Representative band image of the expression of dopamine receptors from western blot analysis, quantification data of D1R and D2R. The D1R/D2R ratio was evaluated. Values of quantification data are given as the mean ± S.E.M. (N = 6). The significance of differences was analyzed by one-way ANOVA followed by Bonferroni's Multiple Comparison Test: *p < 0.05; mean values were significantly different from the 6-OHDA group.
