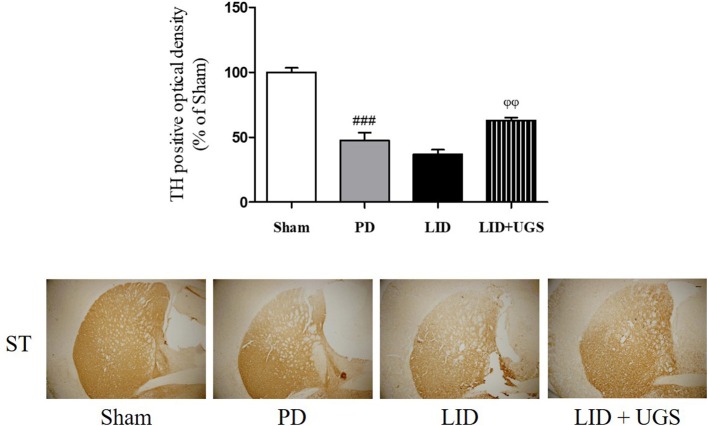
Figure 7.
UGS attenuated the dopaminergic neuronal loss in L-dopa chronically treated the mouse ST. The optical density of TH fibers in the ST was measured. Scale bar = 100 μm. Values of quantification data were given as the mean ± S.E.M. (N = 6). The significance of differences was analyzed by one-way ANOVA followed by Bonferroni's Multiple Comparison Test: ###p < 0.001; mean values were significantly different from the sham group. ϕϕp < 0.01; mean values were significantly different from the LID group.

